All Articles
Every story
Industry Trends & Data
The Average Car Is Now Almost 13 Years Old. Here’s What That Means for Your Bays.
Benjamin Johnson
Drivers are holding on to their vehicles longer than ever. The work is coming. The question is whether your shop is set up to catch it.
The cars rolling into your lot are older than they have ever been. The average vehicle on American roads is almost 13 years old, and that number has climbed every year for almost a decade.
None of this is an accident. New vehicles cost more, auto loans run longer, and drivers are doing the math and choosing to fix what they have. For repair shops, that adds up to the strongest demand tailwind in years.
It also comes with a catch. More old cars means more work per bay, and the industry does not have enough technicians to absorb it. The shops that win will be the ones that turn this wave into hours sold without burning out the people in the bays.
How old is the average car on the road?
The average age of a light vehicle in the U.S. is 12.8 years, according to S&P Global Mobility, the research firm that tracks vehicle registrations and publishes this figure every year. That is a record, and it marks the eighth straight year the average has climbed. The Auto Care Association, the aftermarket’s trade group, puts the figure at 12.9 years in the 2027 edition of its Factbook.
Break the fleet apart and the picture sharpens:
- Passenger cars now average 14.5 years.
- Light trucks, which include SUVs and pickups, average 11.9 years.
- The total fleet grew to 289 million vehicles in operation, even with about 4.5% of vehicles scrapped each year.
- Passenger cars on the road fell below 100 million for the first time since the 1970s as buyers moved to trucks and SUVs.
Age also varies by region. S&P Global Mobility found vehicles in Montana run more than five years older than the national average. The Northern Plains, the Northwest, and Southern states like Mississippi and Alabama all skew older. Colorado and Hawaii are aging far more slowly. Your market might look nothing like the national number, which is why the first step at the end of this article is to check your own repair orders.
Why are drivers keeping cars longer?
Start with payments, and picture a family shopping for a new vehicle this year. The average new-vehicle loan reached $43,610 in the second quarter of 2026, with an average monthly payment of $765 and a term just under six years, according to Experian, the credit bureau that publishes a quarterly report on automotive finance. The household is committing more than $9,000 a year before fuel, insurance, or a single oil change.
Used vehicles do not offer much financial relief. Experian puts the average used loan at $27,852 with a $542 monthly payment and an average interest rate above 11%. Against those numbers, an $1,800 repair on a paid-off 12-year-old car is not a hard sell. It is the cheapest option on the table.
Two other forces are at work. Todd Campau, who leads the aftermarket practice at S&P Global Mobility, points to the durability of modern vehicles as a reason the fleet keeps aging. And the supply shock from the pandemic years is still working through the system. New registrations topped 16 million in 2024 for the first time since 2019, S&P Global Mobility reported, but that was not enough to offset the growing volume of older vehicles already on the road.
What does an aging fleet mean for repair shops?
More vehicles are landing in the age range where shops do their best work. S&P Global Mobility describes the aftermarket sweet spot as vehicles six to 14 years old. In its 2024 analysis, the firm counted more than 110 million vehicles in that range, almost 38% of the fleet, and projected that vehicles six years and older would make up about 70% or more of vehicles in operation for the next five years.
Do the math on your own lot. If your shop sees 300 vehicles a month and seven in 10 are more than six years old, that is roughly 210 vehicles whose factory warranty has run out and whose owners have already decided to keep them on the road. Those are the customers an aging fleet delivers.
The heavy sales years of 2015 through 2019 are a big part of this. S&P Global Mobility points to those historically high volumes as a driver of today’s fleet mix. Those vehicles are now seven to 11 years old, past most factory warranties and squarely in the sweet spot.
Spending rises sharply once a vehicle crosses the five-year mark. Consumer Reports, the nonprofit that surveys its members on out-of-pocket maintenance and repair costs, found that owners spend several times more in years six through 10 than in years one through five. For Toyota owners in its 2023 survey, cumulative spending was about $1,125 in the first five years and about $4,100 in the next five. Consumer Reports’ own summary: costs can skyrocket once the warranty and free-maintenance periods are over.
Where the tailwind shows up on the repair order
Older vehicles bring a different mix of work. There are less warranty-covered diagnostics and more suspension, steering, brakes, cooling systems, and exhaust work. There’s also more rusted hardware, and more repairs that have been deferred for a year or two. That changes how a strong shop runs the front counter. A few habits separate the shops capturing this work from the ones watching it drive away:
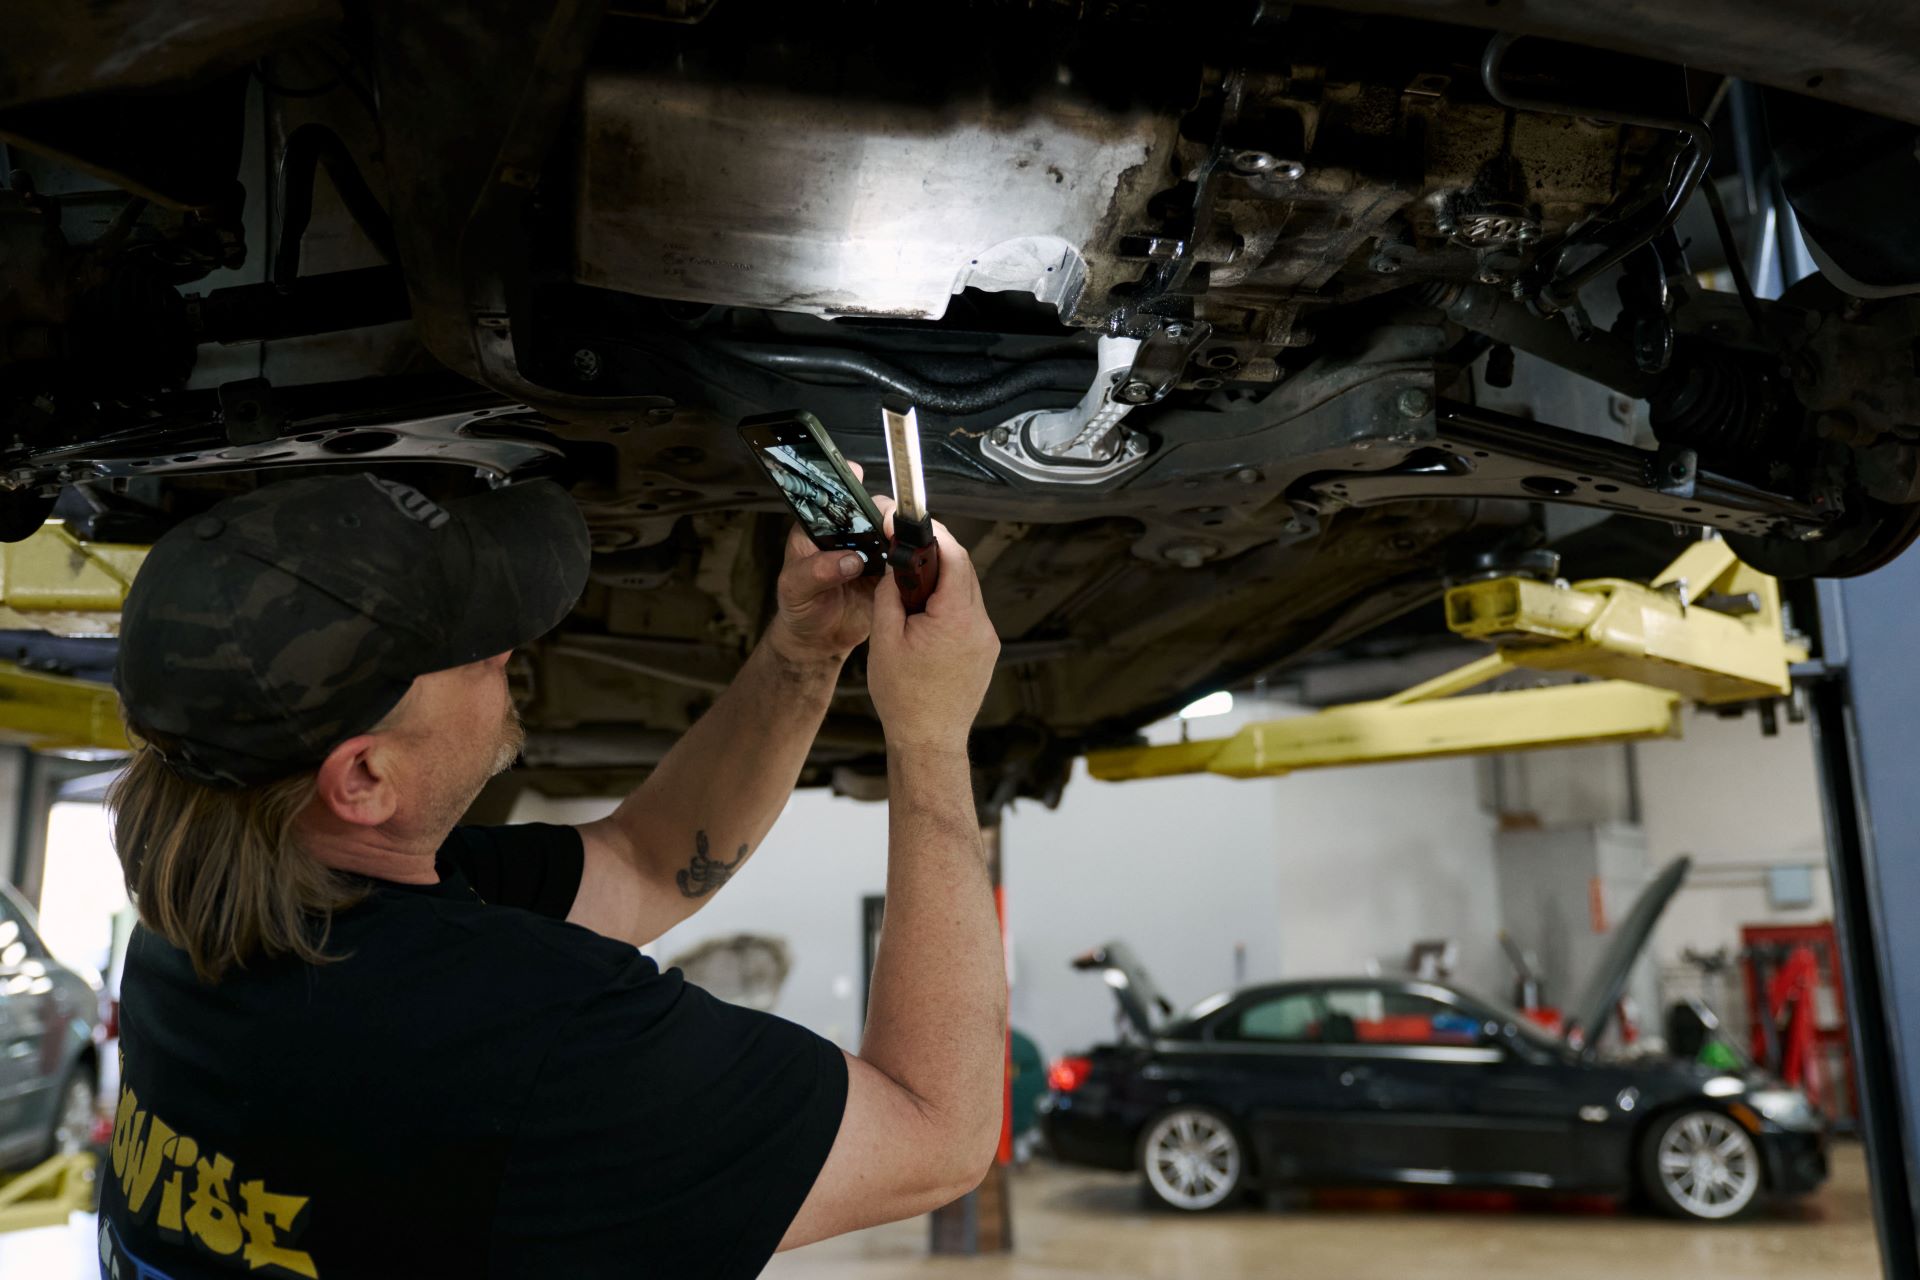
- Inspect every vehicle, every visit. A 12-year-old car almost always has more than one thing going on. A digital vehicle inspection (DVI) with photos lets the customer see what the technician sees.
- Present the whole picture, then help the customer sequence it. Group the findings into what is unsafe now, what is due soon, and what to watch. A customer who sees a plan is more likely to approve the first chunk and come back for the second.
- Price the time honestly. Seized bolts, corroded lines, and brittle plastic add real minutes. If your labor times assume a five-year-old car, you are giving away hours on a 13-year-old one.
- Treat the maintenance conversation as the main event, not the add-on. On an aging vehicle, the fluids, belts, and bushings are the repair order.
A common worry is that older cars mean cheaper customers. The data does not support that notion. Campau at S&P Global Mobility describes a fleet showing “impressive resilience” under high new and used prices. The owner of a 13-year-old car is not broke. They are making a financial decision, and the service advisor’s job is to make that decision easy: show the condition, price the work, and offer a sequence.
The catch: more cars than technicians
Demand is only half the story. The other half is who does the work.
The automotive sector needs about 70,900 new technicians a year, and training programs are producing about 50,100, according to the TechForce Foundation, the nonprofit that tracks technician supply and demand. That leaves a gap of roughly 20,800 technicians a year, with supply covering only 59% of demand. Put plainly, for every 10 technician openings, about six get filled.
The aging fleet is sending more work to shops that already cannot find enough hands. That makes every bay hour more valuable than it has ever been. Three numbers matter most:
- Technician efficiency, measured as billed hours divided by hours worked. If a technician clocks 40 hours and bills 32, that is 80%. On an aging fleet, every point you gain is paid work you did not have to go find.
- Returned vehicles. Every car that comes back for the same complaint takes a bay away from a car that is paying.
- Schedule against capacity. Booking more cars than the bays can finish does not create revenue. It creates waiting customers, rushed inspections, and missed findings.
What to do this quarter
- Pull your own vehicle-age data. Average the model years on your repair orders from the last 90 days. If your fleet is older than the national average, the opportunity is bigger than this article suggests.
- Build a standard inspection for vehicles six years and older. Make it the default, not the exception.
- Audit your labor times against vehicle age. Find the jobs where you are consistently under on older cars and fix the estimate, not the technician.
- Measure technician efficiency weekly. Post it. Talk about it in your weekly touchbases.
- Protect the schedule. Leave room for the work the inspection will find.
Frequently asked questions
What is the average age of a car on the road in the U.S.?
12.8 years, according to S&P Global Mobility’s most recent published analysis. The Auto Care Association’s 2027 Factbook puts it at 12.9 years. Passenger cars average 14.5 years, and light trucks average 11.9 years.
Why is the average vehicle age rising?
Higher new-vehicle prices and longer loan terms, more durable vehicles, and the lingering effect of the pandemic-era shortage of new vehicles. The average new-vehicle payment reached $765 a month in the second quarter of 2026, according to Experian.
Which vehicles generate the most repair work?
S&P Global Mobility identifies vehicles six to 14 years old as the aftermarket’s “sweet spot,” the range where factory warranties have expired and maintenance and repair needs climb.
Does an aging fleet mean more business for repair shops?
Yes. S&P Global Mobility projects vehicles six years and older will make up about 70% or more of vehicles in operation through the late 2020s. But the industry’s technician shortage means shops have to capture that work with the staff they have.
Will electric vehicles change this trend?
Not soon. S&P Global Mobility puts the average age of battery electric vehicles at 3.7 years, and they remain a small share of the fleet. The aging curve for the next several years is dominated by gasoline vehicles.
Shop Finance & Growth
Before You Open a Second Location, Make Sure the First One Runs Without You
Benjamin Johnson
Editor's note: This piece was written by Ed Pate, who spent 25 years owning and operating his own auto repair shop, consulting for shop owners, and helping multi-shop organizations scale. He is now a customer training manager at Tekmetric, where he trains shop owners and their teams on operations.
The most common mistake I saw operators make when scaling to multiple shops had nothing to do with the new location. It had everything to do with the one they already had.
In 25 years running my own shop, consulting for others, and scaling multi-shop organizations, I watched good operators sign leases on location two before they ever answered the most important question: Can my current shop run for five full business days without a single decision from me?
Not mostly. Not if nothing goes wrong. Five clean days of operation.
If the answer is no, you're not ready to scale. You're simply cloning your stress to a second location.
What I Watched Happen
I've worked alongside multi-shop operators at every stage. The ones who scaled successfully shared one thing in common: their original shop ran on documented systems, not on their personal presence.
The ones who struggled had built a shop that ran on them: their approvals, their relationships, their judgment calls. The moment they split their attention, the original location drifted. Car count softened. Average repair order (ARO) dropped. The phone rang constantly because no one on the floor had the authority or the process to handle what came up.
I saw one operator's first location drop 11% in car count within three months of opening his second shop. That's not a staffing problem. That's a systems problem.
The Foundation Has to Come First
A shop that runs on your personality doesn't scale. A shop that runs on documented processes does.
Before any operator I work with is ready to grow, I ask to see four process categories in place. This means they are not in the owner's head, but written down, trained to, and tested.
Operational processes. Every step a vehicle goes through from write-up to delivery is documented. A process that lives in someone's head walks out the door every time that person does. Without it, every employee invents their own version of how to do things and you lose consistency on both ARO and customer experience.
Training processes. Operators with formal 30-60-90-day new hire training programs got new service advisors to full productivity faster than those who trained informally. One shop I consulted with had no defined ramp. Advisors were taking unsupervised calls on day three and developing habits that took months to correct. After building a structured training process, new hires reached a consistent service approval rate by day 60 that previously took five to six months.
Career processes. People leave when they can't see where they're going. The shops that retained their best people had written career ladders such as lube tech to B tech to A tech and service advisor to service manager. Replacing a trained technician conservatively costs $8,000 to $12,000 in recruiting, downtime, and ramp time, plus thousands more in lost production revenue. A visible career path is one of the cheapest retention tools available.
Financial processes. Every shop preparing to expand needs a financial dashboard that someone other than the owner can read and act upon every day. When the owner is the only person who understands the numbers, those numbers stop getting managed the moment the owner's attention shifts to a new location. I've seen parts-pricing errors run uncorrected for months because no one else had been given ownership of the morning financial review. Know your effective labor rate, your parts gross profit percentage, and your car count trend at every location, every single day. If you don't have someone in each shop who owns those numbers, that's the first hire you need to make before you think about expanding.
Technology Is a Force Multiplier, but Only If the Foundation Is There
Processes get you to the starting line. The right technology gets you across it faster.
The operators I watched run multiple locations efficiently did a few things consistently. They checked repair order status, technician productivity, parts gross profit, and daily revenue for every shop from one screen, every morning, without calling anyone. Instead of reacting to problems after they've cost money, owners can catch the drift early. That kind of oversight is simply not possible when you're managing by walking the floor of one building at a time.
Digital vehicle inspections are where I've seen the most direct impact. When a technician documents findings with photos and the service advisor sends them to the customer's phone, the conversation changes entirely. You're no longer asking someone to take your word for it. You're showing them. Approval times come down, ARO goes up, and the trust that builds generates referrals and return visits.
I worked with a multi-shop organization that transitioned from a legacy management system to a modern platform. In their first full year, they saw an average 28.9% increase in revenue across all locations. That number didn't come from the software alone. The processes were already in place. The technology amplified what was already working.
Here's the key distinction: technology scales what you already do well. It also scales what you do poorly. Get the process right first, then let the technology run it at scale.
Build the Machine Before You Buy the Building
The operators who expanded without this foundation didn't just struggle with the new location. They damaged the one that was already working. They lost gross profit at the original shop and decisions were made without authority or process. These costs don't show up on a single line of the profit and loss statement, but they add up fast.
If you're planning to grow, start the process work before you sign the next lease or purchase a second building. Spend 90 days documenting every repeatable task in your current shop. If a process lives only in your head or your best employee's head, it is a liability. Get it on paper, train to it, and stress-test it: take a full week away and see what breaks.
Get that right with one location and the technology you use to scale becomes an investment instead of an expense. Skip it, and every new location inherits the same fragility as the first.

Shop Finance & Growth
Auto Repair Shop P&L Benchmarks: Where Your Money Should Be Going
Benjamin Johnson
Picture a shop that brings in $1 million a year. After paying for the parts and the technicians who install them, about half of that is left. After rent, the service advisor, insurance, utilities, supplies, advertising, software, and the owner's own paycheck, the owner keeps about $100,000, which is a dime out of every dollar.
Is a dime good? It depends on what you compare it to. This guide lays out the public benchmarks that exist for auto repair shop profit and loss statements, shows you how to read your own P&L against them, and is honest about where the data runs thin.
How should a repair shop P&L be organized?
Most shop P&L statements fail before the first number is entered. They lump technician pay into payroll, mix parts cost with shop supplies, and bury the owner's salary in officer compensation. You can't benchmark a statement built that way.
Two profitability measures matter most to shop owners. Gross profit is what's left after you pay for the parts and the technician who installed them. Net profit is what's left after you keep the lights on.
A good shop P&L statement has a few layers:
- Sales. Split into labor sales, parts sales, and anything else you sell in volume (tires, fees, etc.). Each line gets its own row.
- Cost of sales. Parts cost sits under parts sales. Technician wages, including flat-rate pay, bonuses, and payroll taxes on those wages, sit under labor sales.
- Gross profit. Total sales minus cost of sales. Calculate it for labor, for parts, and for the whole shop.
- Operating expenses. Everything else: rent, mortgage, service advisor and office wages, owner salary, insurance, utilities, shop supplies, advertising, software, equipment, interest, and depreciation.
- Net profit. This is gross profit minus operating expenses.
What gross profit margin should a repair shop run?
Go back to the shop above. It keeps $530,000 of its $1 million, a 53% gross profit. Now say it tightens up its parts pricing and lifts parts gross profit by six points. That's $27,000 more a year with the same cars and the same technicians.
More than half of shops clear 50% gross profit. That's the headline from the 2024 Ratchet+Wrench Industry Survey, a trade-magazine survey of repair shop owners. Here's how the shops broke out:
- 60% or higher: about one in five shops
- 50% to 59%: about one in three shops
- Under 40%: about one in five shops
- Don't track it: one in 10 shops
Accountants and business coaches who specialize in repair shops typically coach toward 50% to 55% gross profit on parts and 60% to 70% on labor. Those are targets, not averages. They tell you where well-run shops aim, not where the median shop sits.
Here is how to find yours:
- Parts gross profit is parts sales minus parts cost, divided by parts sales.
- Labor gross profit is labor sales minus technician wages and payroll taxes, divided by labor sales.
- Overall gross profit is total sales minus all cost of sales, divided by total sales.
Be sure to run all three calculations to get a clear view of your business. A healthy overall number can hide a parts margin that is bleeding.
What should technician pay and labor rates look like?
Say your posted labor rate is $140 and your technician makes $30 an hour. On a day the technician bills all eight hours, you bring in $1,120 in labor sales and keep $880 of it after wages. That's a 79% labor gross profit.
Now say the same technician bills only five hours. You still pay for eight. Labor sales drop to $700 and you keep $460, a 66% labor gross profit for the same technician, same rate, and same paycheck. The only thing that changed was the hours billed, and it cost you 13 points of margin.
That is why labor gross profit lives or dies on two numbers: what you charge and how many hours you actually bill.
On wages, the national median for automotive service technicians was $50,620 a year in May 2025, according to the U.S. Bureau of Labor Statistics, the federal agency that tracks employer-reported pay. The mean hourly wage was $24.34. The top 10% of technicians earned $81,790 or more, and the bottom 10% earned $34,660 or less. The spread matters. A shop in a high-wage metro paying $38 an hour needs a very different labor rate than one paying $22.
One in four shops now posts a labor rate of $150 or more. That's the top finding on rates from the 2026 Ratchet+Wrench Industry Survey. Here's where the rest landed:
- $150 or higher: one in four shops
- $120 to $129: about one in six shops
- Under $80: fewer than one in 10 shops
The benchmark that connects these two numbers is effective labor rate: total labor sales divided by total hours technicians were paid. In the five-hour example above, you billed $700 but paid for eight hours. Your effective labor rate that day was $87.50, not $140. The gap is wages you paid for hours you never billed. Be sure to track it weekly.
What do operating expenses look like as a share of sales?
This is where the public data gets thin, and you should know that before you trust any number you read.
The only broad, verifiable breakdown of shop expenses comes from federal tax returns. ProjectionHub, a financial-forecasting firm, analyzed more than 228,000 sole-proprietor auto repair returns from 2019. Here's where the money went, as a share of sales:
- Parts: about a third
- Supplies: 7%
- Rent: 6%
- Vehicle expenses: 5%
- Depreciation: 4%
- Utilities: 3%
- Taxes: 2%
- Net profit: 10%
Take these numbers as directional rather than a concrete path. They come from sole proprietors with average sales of about $68,000, so the sample is mostly one- and two-person operations. And because an owner's own labor isn't an expense on a sole-proprietor return, technician wages show up far lower than they would at a shop with a payroll.
Still, the data shows where overhead goes. Rent, supplies, and utilities together eat 15 to 16 cents of every dollar at the small end of the industry.
Rent is the one to watch, because it doesn't change when sales do. A shop paying $5,000 a month in rent spends 6% of sales on it at $1 million a year. If that same shop grows to $1.5 million, the rent stays $5,000 but drops to 4% of sales. If sales slip to $750,000, the same rent climbs to 8%. That's why bigger shops usually run a lower rent percentage, and why a slow year hurts twice.
For everything else, the honest answer is that there is no current, public, verifiable benchmark for insurance, advertising, software, or office wages as a share of sales at a full-size repair shop. Use the previous 12-month period as the baseline and watch for drift quarter to quarter.
What net profit should a repair shop expect?
Back to the $1 million shop keeping a dime on the dollar, or $100,000. It lands right in the middle of the pack.
Shops land all over the map on net profit, according to the 2024 Ratchet+Wrench Industry Survey. Here's how they broke out:
- 20% or higher: about one in five shops
- 15% to 19%: about one in five shops
- 10% to 14%: one in five shops
- Under 10%: about one in eight shops
- No net profit at all: one in 25 shops
- Don't track it: about one in five shops
Add up the top three bands and roughly six in 10 shops are at 10% or better. Notice the other finding hiding in that list: one in five owners can't tell you what they keep.
The number that should stop you is this one: 22% of shops said they don't track net profit margin. More than one in five owners could not tell you what their profit margins are.
Coaches commonly set 20% net profit as the target for a well-run shop. At $1 million in sales, the gap between 10% and 20% is $100,000 a year, and most of it comes from gross profit.
What are the shops that track their numbers doing differently?
Tracking your numbers is the one habit the survey ties directly to higher revenue. In the 2026 Ratchet+Wrench survey, 86% of respondents said they track key performance indicators, and shops that do were three times more likely to exceed $1 million in annual revenue. The KPIs the report lists are the same lines on your P&L: share of sales from maintenance, repair, and tires, overall gross profit, parts gross profit, labor gross profit, and net profit.
The average repair order tells the same story. Almost three-quarters of surveyed shops, 74%, reported an average repair order of $800 or more, and 15% reported $2,000 or more. Another 15% said they don't measure it.
One thing to note: geography is important. A $150 labor rate in Houston and a $150 labor rate in rural Nebraska are not the same business. Benchmark against shops your size in markets like yours wherever you can, and treat national figures as a sanity check, not a target.
You can't benchmark a number you don't track. That is the first fix, and it costs nothing.
How to benchmark your shop this week
- Pull your previous 12-month P&L data and add a percent-of-sales column.
- Move technician wages and payroll taxes out of payroll and under labor sales. Move parts cost under parts sales.
- Calculate parts gross profit, labor gross profit, and overall gross profit. Compare that to 50%, the mark more than half of shops clear.
- Calculate effective labor rate: labor sales divided by paid technician hours. Compare that to your posted rate.
- Calculate net profit. See where you land against the net profit numbers above.
- Pick the single line furthest from the coaching benchmarks. Fix that one first.
Frequently asked questions
What is a good gross profit margin for an auto repair shop?
More than half of surveyed shops run 50% or higher overall, according to the 2024 Ratchet+Wrench Industry Survey. Coaches who work with shops typically target 50% to 55% on parts and 60% to 70% on labor.
What is a good net profit margin for an auto repair shop?
Roughly six in 10 shops that track it report 10% or better, and about one in five report 20% or more. Twenty percent net is the figure coaches commonly treat as the mark of a well-run shop.
What percentage of revenue should rent be for a repair shop?
IRS data on sole-proprietor repair shops shows rent at about 6% of revenue, but that sample skews very small. Larger shops typically run lower because rent doesn't scale with sales.
What is the average labor rate for an auto repair shop?
In the 2026 Ratchet+Wrench Industry Survey, 25% of shops posted $150 or more per hour, and 17% posted $120 to $129. Rates vary widely by market.
How much do technicians make?
The national median wage for automotive service technicians was $50,620 in May 2025, according to the U.S. Bureau of Labor Statistics.

Shop Finance & Growth
Why the Next Stage of Growth for Your Auto Repair Business Might Depend on Hiring a Chief Operating Officer
Benjamin Johnson
Editor’s note: This piece was written by Bryan Stasch, vice president of coaching, peer groups, and member success at Auto Shop Answers, a Houston-based training and coaching company for repair shop owners. He started in the industry as a technician in 1984, co-owned three repair shops, and has spent more than 25 years coaching shop owners and their leadership teams.
There comes a point in the growth of an auto repair business when working harder stops working.
The business might be producing record revenue. The team is larger. There are more technicians, more customers, better systems, and perhaps multiple locations. From the outside, the company looks successful.
But inside, the owner may be experiencing something very different.
Managers still bring problems to the owner. Important decisions wait for the owner. Difficult customer situations find their way to the owner. Hiring decisions require the owner. Employees bypass managers because they know the owner will give them an answer. The business has grown, but the leadership structure hasn’t.
Eventually, every successful shop owner has to confront an important question: Can this business continue to grow if I remain one of the primary people required to make it work?
For many owners, the next stage isn’t about hiring another technician, adding another service adviser, or even finding another manager. It might be about developing another executive. In some cases, it might be time to start hiring for a chief operating officer.
A COO Is More Than a Title
One of the biggest mistakes owners make is confusing a strong manager with an executive.
A great service manager can effectively manage workflow, technicians, advisers, customers, and daily production. A general manager can oversee multiple departments and take tremendous responsibility off the owner’s plate.
Those are important roles. But the transition to COO requires something more.
The COO isn’t simply responsible for getting things done. The COO becomes responsible for building an organization capable of consistently getting the right things done without requiring the owner to drive everything forward.
That requires thinking beyond today’s repair orders, staffing problems, and production numbers.
A COO must learn to think about execution, systems, people, performance, capacity, accountability, and leadership. Most importantly, a COO must learn to develop other leaders rather than becoming the person everyone depends upon. Otherwise, we’ve simply replaced one problem with another and switched the owner bottleneck with a management one.
Why Successful Shops Hit a Leadership Ceiling
Think about how most repair businesses are built.
In the beginning, the owner does almost everything from answering the phone to working on cars. As the company grows, you add people and transfer responsibilities. But growth also creates complexity.
More technicians require more production management. More advisers require more sales leadership. More employees create more communication and accountability needs. More revenue creates greater financial complexity. Multiple locations multiply the need for leadership, systems, consistency, and decision-making.
Eventually, the owner’s personal capacity becomes one of the constraints on the organization. That doesn’t mean the owner has failed. It often means the business has outgrown the leadership structure that created its success.
The question changes from running the business itself to building a leadership structure, which is an entirely different strategy.
Don’t Start by Hiring a COO
This might sound strange in an article about COO development, but I wouldn’t begin by putting COO on someone’s business card.
Start with the work. Take a hard look at your organization and ask: What still requires me that shouldn’t? Look at the decisions reaching you every week, your calendar, the problems people bring you, meetings that don’t function well without you, and what departments you still personally drive. Then ask: Who should eventually own these outcomes?
You might discover that someone already inside your organization has the potential to become that leader. We often evaluate people based on what they’re capable of doing today instead of considering what they could become capable of doing tomorrow. You aren’t simply looking for someone who can run the shop. You’re looking for someone who can develop the capacity to lead the operating organization.
Build an Executive Partnership
I like to simplify the CEO/COO relationship this way: The CEO executes the vision, strategy, and growth. The COO is responsible for the execution, systems, people, and performance.
There will naturally be overlap. Financial performance, leadership development, culture, strategic execution, and organizational capacity require both executives. But the distinction matters.
The CEO should increasingly ask: Where are we going?
The COO should increasingly ask: What must the organization become capable of doing to get us there?
Imagine an owner wants to grow from one location to three. That's the vision. But vision doesn’t create scalability.
Someone must determine what three locations require in management structure, technician capacity, staffing, processes, key performance indicators, communication, accountability, training, systems, and leadership.
The CEO sees the opportunity. The COO builds the organizational capability required to execute it.
That’s when the relationship becomes more than delegation. It becomes an executive partnership.
You Can’t Delegate Someone Into Becoming an Executive
Here’s where many owners struggle.
They identify a capable manager and begin handing things over. People problems. Production. Meetings. Hiring. Customer complaints. Scheduling. Pretty soon, that manager has an enormous list of responsibilities. But more responsibility doesn’t automatically create greater executive capability.
COOs have to be developed.
They need to learn how to make decisions without constantly seeking owner approval. They need enough financial acumen to understand how operational decisions affect gross profit, payroll, cash flow, and profitability.
They also need to understand organizational capacity and identify constraints. They need to build systems instead of repeatedly solving the same problems, conduct difficult accountability conversations, and coach while developing future leaders. And they need to anticipate what tomorrow’s business will require instead of merely responding to what today’s business demands. Perhaps most importantly, they need to develop executive judgment.
A developing manager asks: “What do you want me to do?” A developing executive says: “Here’s what I’m seeing. Here are the options. Here’s what I recommend.” Eventually, you want to hear: “I’ve got it. I’ll keep you informed.”
That’s not just a change in language. It’s evidence that leadership capacity is being transferred.
The Owner Has to Develop, Too
There is another side of COO development that doesn’t receive enough attention. Owners cannot develop a COO while continuing to behave as if they’re the only person allowed to lead. The owner has to develop, too.
You must learn to transfer authority along with responsibility. That means allowing another capable leader to make some decisions differently than you would. It also means resisting the temptation to jump back in whenever things become uncomfortable, and refusing to let employees bypass leadership because coming directly to you is faster.
It means replacing, “I’ll take care of it,” with, “Who should own this?”
This is why developing a COO isn’t only COO development. It’s CEO development, too. If the COO keeps sending decisions upward, the owner remains the bottleneck. If the CEO keeps taking decisions back, the COO never develops.
Both leaders have to evolve.
Start With the 30-Day Question
Here’s an exercise you can do today. Ask yourself: If I disappeared from the business for 30 days tomorrow, what would break?
Don’t think about whether you could leave. Imagine you had no choice.
- What decisions would wait?
- Which employees would struggle?
- Which meetings would stop working?
- Which numbers wouldn’t get reviewed?
- Which customer situations would escalate?
- Which projects would stall?
Your answers reveal where the organization still depends on you. For every dependency you identify, ask two more questions: Who should eventually own this? And what prevents them from owning it today?
Maybe the problem is clarity. They don’t know what they own. Maybe it’s capability. They haven’t been developed yet. Maybe it is authority. You’ve given them responsibility but still require your approval. Maybe it’s a missing system. Maybe it’s accountability. Those questions begin turning owner dependency into a leadership-development strategy.
Don’t Create Another Bottleneck
There’s one more question that’s equally important. Once you’ve identified the potential COO, ask: If that person disappeared for 30 days, what would break?
This is where COO development can go wrong. The objective isn’t to transfer every dependency from the owner to one highly capable manager. The COO must also build leaders beneath them. A mature COO doesn’t measure success by how many problems they can personally solve. They measure success by how capable the organization becomes because of their leadership.
Instead of answering every question, they begin asking: What do you recommend? Instead of owning every decision: Who should own this? Instead of repeatedly fixing problems: What keeps causing this?
That’s how leadership capacity begins multiplying throughout the organization.
The Goal Isn’t to Make the Owner Unimportant
Some owners resist the idea of greater independence because they equate being needed with being valuable. Those aren’t the same thing. The goal isn’t to make the owner unnecessary; it is to make the owner’s daily involvement unnecessary. There is an enormous difference.
As the organization develops, the owner’s highest value should increasingly come from vision, strategy, leadership development, growth, relationships, capital allocation, acquisitions, and building enterprise value, not from solving Tuesday afternoon’s production problem.
That’s why developing a COO is much bigger than filling a position. You’re building leadership capacity, creating organizational capacity, and reducing key-person dependency. You’re creating room for the CEO to actually become the CEO. And you’re beginning to create something many owners wanted when they started their businesses but unintentionally built themselves out of: choice.
The choice to work in the business because you want to, not because the business requires you to. That’s when you’ve moved beyond simply building a successful repair shop. You’re building an enterprise capable of performing beyond its owner.
And that’s where owner independence truly begins.
About the Author
Bryan Stasch works with auto repair shop owners and their leadership teams to develop stronger executives, build leadership capacity, improve business performance, and create businesses that are less dependent on the owner. His work focuses on CEO and COO development, financial and operational performance, leadership systems, enterprise value, and owner independence.
Customer Experience
How Visual Proof Turns a "No" Into Approved Repairs
Customers don't decline work because they can't afford it. They decline because they can't see it.
Every service advisor knows this phone call. A technician found worn brake pads, a leaking valve cover gasket, and a tire with cord showing. You call the customer, walk through the list, quote the price, and hear the same four words: "I'll think about it."
Chances are, they won't. "I'll think about it" is a polite no, and it has very little to do with the repair itself. The customer is not weighing your estimate — they are deciding whether to believe you. That is the real job at the counter, which boils down to trust. The easiest way to drive more business is to stop describing problems to customers and show them what’s wrong.
Why Customers Say No
Picture a customer who had one bad experience at a shop years ago. They were told they needed something, paid for it, and never knew if it was real. Now, you are telling them they need a $700 brake job on a car that stops fine. Nothing you say over the phone can prove you are different from the last shop.
Distrust of automotive repair is a common problem. Roughly two in three U.S. drivers say they do not trust auto repair shops in general, according to a consumer survey from AAA, the motor club and roadside assistance organization. When AAA asked why, the top answer was not price. It was the fear of being sold work they did not need.
The breakdown from that survey:
- 76% cited shops recommending unnecessary services
- 73% cited overcharging
- 63% pointed to a bad past experience
- 49% worried the work would not be done correctly
There is a second reason customers decline, and it is just as fixable. The Auto Care Association, the trade group for the aftermarket, pegged knowingly delayed maintenance at about $25 billion a year, drawing on a survey of more than 100,000 households. Consumers gave three main reasons for putting work off: money, convenience, and a belief that the delay was not really hurting the car.
Your customer suspects the recommendation might be padded, and they think the problem is not that bad anyway. A phone call cannot fully address either doubt. A photo of a brake pad worn to the backing plate answers both questions in the customer’s mind.
What Research Says About Digital Vehicle Inspections
Start with the math. Say a service advisor recommends $1,500 of additional work across a handful of cars on a Tuesday. If about one in six customers says yes, the shop sells roughly $250 of it. If about four in 10 say yes, the shop sells roughly $600 of the same work. The only thing that changed was whether the customer saw the problem.
Those two approval rates are not made up. They come from the 2025 U.S. Aftermarket Service Index from J.D. Power, the consumer research firm best known for its satisfaction rankings. Among full-service maintenance and repair customers who received a multi-point inspection with photo or video, 41% had the recommended work done. Among customers who received the inspection without photo or video, only 17% did. The study surveyed 10,348 vehicle owners.
The year before told the same story. In J.D. Power's 2024 Aftermarket Service Index, 51% of customers who got a photo or video with their inspection approved the recommended work, compared with 24% who got the inspection alone. That’s roughly half versus roughly one in four. That study also found that 23% of customers did not receive a photo or video at all, which means most shops are leaving money on the table.
Why a picture does what a phone call can't
The pattern across the research is consistent enough to ask why it holds. Part of it is how people process information. Psychologists have shown since the 1970s that people recall pictures far better than words, a finding known as the picture superiority effect and tied to work by researcher Allan Paivio. A customer who hears "your pads are at two millimeters" has to hold a number in their head and decide what it means. A customer who sees a photo of a thin pad next to a new one does not have to decide anything. Digital vehicle inspection images tell the whole story.
The bigger part is what the picture does to the trust question. Remember the top fear from the AAA survey: being sold work they do not need. A verbal recommendation asks the customer to take your word for it. A digital vehicle inspection photo of the part on their car moves the conversation from an issue of trust to actually seeing a problem firsthand. Most customers that are shown a tire with steel cord poking through do not need to trust anyone. They can see it.
Visual proof also handles the second objection, the one from the Auto Care data about customers believing repair delays are harmless. A photo of coolant crusted around a water pump weep hole makes the danger of waiting concrete. The customer is no longer picturing a vague future failure. They are looking at the start of one.
Put Visual Proof to Work at the Counter
Shooting photos for digital vehicle inspections is not the hard part. Most technicians already carry a phone. The hard part is doing it in a way that actually moves a decision. Shops that get consistent results tend to do a few things the same way.
Shoot the problem next to the standard. A photo of a worn pad means nothing to someone who has never seen a new one. A worn pad beside a new pad, or a tread gauge sitting in the groove, gives the customer the comparison they need to judge for themselves. The goal is a picture that needs no explanation.
One finding, one photo, one sentence. Thirty pictures of the undercarriage tells the customer you are thorough and tells them nothing else. Pair each recommendation with the single image that proves it and a plain-language line about what happens if it waits.
Send it before you call. Customer satisfaction gains are largest when photos and videos arrive early in the visit. A customer who has already looked at the photos and videos is having a different conversation when the phone rings than one with no information. You are no longer convincing them and instead are answering their questions.
Lead with safety, then the rest. Sort the findings so the first digital vehicle inspection photo the customer sees is the one that matters most. Tires, brakes, and steering components go first. Cabin filters go last. Customers who approve the safety item often approve the next one, too.
Show the good news, too. A photo of a healthy belt or a clean air filter, marked as fine, does two things. It proves the inspection was real, and it proves you are not padding the list. That second point is the direct answer to the top fear in the AAA data, and it costs you nothing.
Let the customer keep the proof. A photo the customer can pull up on their own phone six months later does more for your shop than the sale it closed today. It is the receipt for your honesty. When the next shop tells them they need something, they will remember who showed them the part.
Frequently asked questions
Do photos really increase repair approval rates?
Yes, across every major consumer study that has measured it. The clearest aftermarket figure comes from J.D. Power's 2025 U.S. Aftermarket Service Index, where 41% of full-service repair customers approved recommended work when it came with photo or video, compared with 17% without. The exact lift varies by study and customer type, but the direction has held for a decade.
Is video better than photos?
The research groups photo and video together, so there is no clean public data separating them. In practice, a short video works best for things a photo cannot capture, like play in a tie rod or a noise from a wheel bearing. A photo is faster to shoot, faster to review, and enough for most wear items.
How many photos should go with an inspection?
Enough to prove each recommendation, and no more. One clear image per finding, with a one-line note about what it means. Add a few "this is fine" photos to show the inspection was real. If a customer has to scroll past 25 images to find the one that matters, most will not.
When should the customer see the photos?
Before the phone call, not during it. Send the inspection results, give the customer a few minutes to look, then call. The conversation shifts from explaining the problem to answering questions about the fix.
What if the customer still says no?
Some will. A photo removes the trust objection, not the budget objection. When a customer declines a documented safety item, note it on the repair order, keep the photo attached, and let them know you will check it again next visit. The documentation protects the shop, and the customer now knows exactly what they are driving on.

Customer Experience
Stop Quoting Prices Over the Phone. Get Cars in Bays Instead.
Editor's note: This piece was written by Zack Wade, who spent more than a decade in auto repair, starting as a technician and service advisor before managing multiple service centers, running his own shop as managing partner, and overseeing operations for a six-shop auto repair group in Colorado. He now works as a customer training manager at Tekmetric.
Every shop owner should know their phone call conversion rate, and most aren't happy with it once they look.
The main goal of any incoming phone call should be a customer walking in the door and their car ending up on your lift. There are plenty of best practices to make that happen, and just as many pitfalls that can stop it.
One of the most common pitfalls, and one I see almost daily, is offering pricing, estimates, or labor rates over the phone. Holding back can feel wrong, especially if you think about it as a consumer yourself: "Why shouldn't I be able to call a business and ask for the exact price of something?"
But you, I, and anyone reading this know two things. The auto repair business isn't exact. And, odds are, the customer calling around to price shop won't show up anyway unless you and your team turn that request into a call to action.
Why Quoting Over the Phone Costs You the Car
Start with the question itself. When a caller asks how much a repair costs, they're asking for a number you can't honestly give. Unless the service has zero price variation from car to car, any figure you offer is a guess.
The usual workaround is to build an estimate on the spot or call back with one. That's a pitfall, too. It's not efficient. Maybe the call turns into an appointment or a customer walking in. Just as often, the caller thanks you, says they'll let you know, and moves on to the next shop on their list.
There's another problem: everything you don't know about this customer and their car. That makes it hard to price the estimate accurately. It also makes it hard to track the interaction and follow up later.
Yes, you could take down their name, number, and contact info and open a full repair order. But now we're back to wasting time. You have cars in your shop and customers already paying for your expertise.
The same problems apply to the labor rate question. The caller asks, you tell them $160 an hour, they say thanks, and the line goes dead.
What the Best Training on This Taught Me
This is a polarizing topic across our industry, with valid points on both sides. I've attended multiple classes, coachings, and trainings on it. One stuck with me. I took it to heart and practiced it with great success in my own shops for years.
That training could have filled several days on how to stop offering pricing over the phone while staying professional and, let's be honest, not ticking potential customers off. Here's my condensed version, and my answer to every pitfall above.
How to Answer the Price Question
The phone rings and the caller wants to know how much a repair costs. Don't give a number. Tell them what you've found works best is a free, no-obligation inspection and estimate so the price they get is accurate. Then offer a time. If a bay is open right now, say so.
Most callers push back once. They just want a price. They'll settle for a guesstimate, and they promise not to hold you to it. You, I, and everyone reading this know that promise doesn't survive the invoice.
Hold your ground, politely. Explain that pricing is anything but exact, and that you'd hate to start a relationship by naming a figure that turns out drastically different once a technician has the car in front of them. Then, make it easy. Offer coffee while they wait for the estimate. Ask whether there's a day they'll already be in your part of town.
How to Answer the Labor Rate Question
The labor rate question gets the same treatment. Tell the caller your rates vary depending on the work, then ask what they need done. Mention that you have bays open right now.
Answer their question with a question, then move into discovery. If they push, fall back to convenience. Get them in the door now.
I've done this several times on calls and converted potential customers into someone walking through the door. There's a lot more to putting this into practice than fits in one article, but it's worth the effort to better communicate the auto repair process to customers.
Convenience Has to Come First
All of this depends on your shop's ability to be convenient. You can't offer immediate service if you can't take a car at the moment. That has to come first. A shop booked solid for the next three weeks isn't convenient, and that isn't a good thing.
None of this is about being deceptive or withholding prices to be difficult. It's about making more conscious decisions when you answer the phone, asking better questions, and making those calls work to your shop's benefit.

Shop Operations
Parts Sourcing and the Hidden Cost of Dead Stock
Benjamin Johnson
Walk into your parts room and pick up the first thing you see on the shelf. If you cannot say what vehicle it was ordered for, who ordered it, or when, you are holding money that has stopped working for you.
Say the back shelf holds $2,000 in parts that have not moved in a year. That is $2,000 you already paid your supplier, and it is not helping your business do anything useful. And if the part is an electronic module or a sensor for a model your shop no longer sees much of, it might never leave the shelf.
Most shops in this business do not run a warehouse. You order parts per repair order, same day, from suppliers within a few miles. That is exactly why dead stock hides so well. It never shows up as a wasted line item.
Parts are now one of the biggest problems in the shop
This is a consistent issue. In a survey of 500 repair shops fielded in December 2025, market research firm IMR Inc. asked owners to name their biggest challenges heading into 2026. Finding affordable parts and dealing with rising prices came in first, cited by almost half, some 46%, of shops. Roughly half the shops surveyed named parts costs as an issue before they named anything else. Another 22.8% said they are affected by parts shortages and have trouble receiving the parts they need.
Parts issues beat out the technician shortage as a top issue affecting shops, which was reported by 23.8% of shops. That is a real shift. For most of the past decade, staffing challenges led every list.
There are three main forces behind the parts problems.
First, price. The U.S. Bureau of Labor Statistics tracks what parts manufacturers charge through its Producer Price Index. Prices for motor vehicle parts manufacturing rose 2.2% in 2025, and 4.4% across the three years ending in December 2025. That is the wholesale side of the ledger, before your supplier's margin and before your markup.
Second, trade policy. A U.S. Federal Register notice published in April 2025 put a 25% tariff on certain imported automobile parts, effective May 2025. U.S. Customs and Border Protection issued implementing guidance to the trade on May 1, 2025; a separate action extended a 25% duty to medium and heavy-duty vehicles and specified parts effective November 2025. The list of affected parts changes each quarter through a review process, which means a component that was not covered last quarter can be covered this one.
Third, complexity. S&P Global Mobility reported in May 2025 that the average age of a light vehicle in the United States reached a record 12.8 years, with about 289 million vehicles on the road. Passenger cars now average 14.5 years.
An older, larger, more varied fleet is good news for your car count, but it is hard news for your parts room. More vehicles in service means more part numbers per job and the more chances that the correct part is two counties away.
What dead stock actually costs you
There is no credible public figure for what share of a mechanical repair shop's inventory goes dead. Dealership parts departments have benchmarks because manufacturers track them. Nondealership shops do not. If you have seen a confident percentage quoted somewhere, ask where it came from.
What is well established is the cost of carrying inventory. The Institute for Supply Management, the professional body for supply chain practitioners, has published that carrying cost commonly runs between 20% and 30% of inventory cost per year, while noting plainly that there are no consensus benchmarks for the measure. The Association for Supply Management puts the working range at 15% to 25%. Those figures come from across all industries, not from auto repair specifically, so treat them as a frame rather than a number to put on your profit and loss statement.
Carrying a part that’s unused creates several issues:
- The money paid for the part is lost
- The part occupies space in your shop
- It takes labor to move parts and count them
- Shops suffer from shrinkage and obsolescence when parts stop being sellable
Now, run it on your own shelf. Say you have $2,000 in parts that have not moved in a year. At 25%, a rate that falls inside both published ranges, that costs you about $500 a year. You never see that money leave the building. And it is on top of the $2,000 you cannot spend on anything else.
Do the same math on a $10,000 parts room. That is roughly $2,500 a year, which is about the same amount as a technician's tooling budget. The parts sitting in your inventory impact your bottom line in ways you don’t see or realize.
Reorder discipline: the three moves that stop the bleeding
None of what follows is new. These are standard inventory control methods that supply chain professionals have taught for decades, codified in the APICS Dictionary published by the Association for Supply Chain Management. They scale down to a parts room with 200 line items just as well as they scale up to an entire distribution center.
Sort your parts by what they actually cost you. ABC analysis applies the Pareto principle to inventory. Rank every part you stock by annual dollar usage, which is unit cost multiplied by the number of units you go through in a year. The top group, your A items, will typically be a small share of your part numbers and a large share of your dollars. Those get tight control, frequent counts, and carefully set reorder points. Your C items, the cheap high-volume stuff like clips, filters, and bulk fluids, get loose control because the cost of managing them closely exceeds what you would save.
Set a floor and a ceiling for everything you stock. Set a floor and a ceiling for everything you stock. Min-max is as simple as it sounds. The minimum is the count that tells you to reorder. The maximum is the count you reorder back up to. Setting the minimum means answering two questions: how many of these do you use in a week, and how many days does it take your supplier to get you more. Multiply weekly usage by supplier lead time in weeks, then add a cushion for the weeks when demand spikes or the truck is late. That cushion is your safety stock.
Count a little, constantly, instead of everything, once. Cycle counting is an inventory accuracy technique where you count on a rotating schedule rather than shutting down for an annual inventory count. The APICS Dictionary defines it that way, and it pairs naturally with ABC analysis: count your A items monthly, your B items quarterly, and your C items once or twice a year. Ten minutes on a Tuesday morning beats a Saturday with the doors closed, and it catches a bad count while the paperwork is still fresh enough to explain.
Add one rule that is not in any textbook: Any part that has not moved in 12 months gets a decision, not another year of quiet storage. Return it if the window is open. Sell it at cost to a shop that sees more of that platform. Use it on the next applicable job even if the margin is thin. The worst outcome is the one where you do nothing because doing nothing still costs you money every month.
Sourcing resilience: depth beats loyalty
Sourcing resilience means you can get the right part. It is not about stocking more. It is about having more ways to receive parts.
Know your suppliers' actual delivery cutoffs, not the ones on the website. A supplier who can get you a part by 2 p.m. is worth more on a same-day job than one whose price is $8 better but whose truck comes the next day.
Track your own fill experience by supplier. For 30 days, note on each repair order which supplier you called first and whether they had it. At the end of the month, you will know who actually supplies your business in a timely fashion.
Price delays, not just parts. If saving $40 on a part means a car sits in a bay overnight, you have traded $40 for billable hours. Ask your service advisers to schedule repairs that also fit parts ordering timelines.
Be honest with customers about the difference. When a part is genuinely two days out, communicate that to the customer. A customer who is not informed their vehicle isn’t going to be returned for days is a bad review waiting to happen. Your advisers cannot manage that conversation if the parts status lives in one person's head.
Start here
Pick one afternoon this month. Walk into the parts room with a clipboard and put every item into one of three buckets: moved in the last 90 days, moved in the last year, has not moved in a year. Add up the dollar value of that third bucket. Then take a quarter of that number. For instance, if the third bucket comes to $6,000, you are paying about $1,500 a year in rent on it, and the $6,000 itself is doing nothing.
Frequently asked questions
How do I know if a part on my shelf is dead stock? Use time, not judgment. Any part that has not been used or sold in 12 months gets a decision: return it, sell it, use it, or write it off. There is no public benchmark for what percentage of a shop's inventory should be dead, so the only useful measure is movement inside your own four walls.
What is a good inventory turn rate for a repair shop? No industry association publishes one for nondealership shops. The commonly quoted target of six to eight turns a year comes from dealership parts department data. Track your own turn rate over a year and improve against yourself rather than against a number borrowed from a different business model.
Should I stock more parts to protect against shortages and tariffs? Not broadly. Stocking deeper on your true A items, the parts you use constantly and know you will sell, can make sense when lead times stretch. Stocking broadly across parts you use twice a year converts a supply problem into a carrying cost problem. Published carrying cost ranges run roughly 15% to 30% of inventory value a year across industries.
How do I set a reorder point? Take how many of the parts you use in a week, multiply it by how many weeks your supplier takes to deliver, then add a cushion for demand spikes and late trucks. Write that number on the bin as the minimum, and write the highest quantity you want on hand as the maximum.
Are core charges taxable? It depends on the state. California's tax agency, for instance, publishes guidance requiring that the core credit be subtracted before tax is calculated and that the shop refund the tax reimbursement tied to the deposit when the core is returned. Other states treat it differently. Ask your accountant about your state specifically.
Shop Operations
What Changes When You Run Multiple Shops
Picture your shop running $150,000 a month. You know every car on the lot. When a repair order stalls, you notice before anyone tells you. When a technician is having a bad week, you can see it from the counter.
Now picture the same $150,000 shop, plus a second one 20 minutes away doing $70,000 and climbing slowly. You are in the truck four days a week. Both shops are running at about 80% of what they should be because you are giving each one half of the attention that made the first one work.
That is the transition multi-shop owners must navigate. It is not a scale problem. It is a job change. Your income used to come from cars you touched, and now it comes from decisions other people make in a building you are not standing in.
The first thing that breaks is the part you never wrote down
Your first shop runs on process. Most of it just isn't written anywhere.
You know that a car with a check engine light gets a diagnostic sold before anything else gets quoted. You know which parts vendor to call second when the first one is out. You know that the customer who asks three questions about brake pads is going to ask three more, so you build 15 extra minutes into that phone call. Nobody trained you on any of that. You built it, and then you became the place it lives.
At one location, being the process works fine. At two, it stops working immediately, because you can only be in one building at a time. Whatever isn't written down gets reinvented at the second shop by whoever happens to be standing there. Sometimes they reinvent it well. Often they don't, and you find out six weeks later when a customer calls you directly about something your second location handled in a way your first location never would.
Your results now arrive through somebody else
Here is the uncomfortable math of location two. You are no longer selling work, fixing cars, or handling upset customers. You are selecting and coaching the person who does.
Gallup, the workplace research firm that has surveyed millions of employees across two decades, found in its research on managers that managers account for at least 70% of the variance in employee engagement between business units. Read that plainly: when one team is running hot and another team in the same company is dragging, most of the difference traces back to the person leading it, not to the pay plan, the building, or the market.
Gallup also estimates that about one in 10 people has strong natural talent for managing others, with another two in 10 having enough to work with if they get real coaching. That is roughly three in 10 people who can do this job well, which means the odds are against the lead technician you were planning to promote on Monday.
That is not a reason to avoid promoting from within. Your best technician often does become your best manager. It is a reason to stop assuming the promotion is the plan and start treating manager selection as the highest-stakes decision in the whole expansion. You can fix a bad parts vendor in a week. A bad manager at your second location costs you a year and a customer base.
What the management layer actually costs
Most owners budget the lease, the lift, and the sign. Fewer budget the org chart.
Say you promote your lead technician to run location one so you can be at location two. You just made two decisions at once. You added a supervisor's salary, and you took a producer out of the bay.
Federal wage data puts a number on the first part. The Bureau of Labor Statistics tracks automotive service technicians and mechanics under occupation code 49-3023, and first-line supervisors of mechanics, installers, and repairers under code 49-1011. In the May 2023 national wage estimates, the median annual wage was $47,770 for technicians and $75,820 for those supervisors. Same reference period, same survey, so the comparison is fair. The gap is about $28,000 a year.
Then run that against what a shop actually keeps. Paar, Melis & Associates, an accounting firm that specializes in repair shops, reported an average net profit of 9.6% in its 2025 benchmark report built from its own clients' financials. That sample is self-selected, since it reflects shops already working with a specialist CPA, so read it as a good-shop number rather than an industry average.
At a 9.6% net margin, covering $28,000 of new salary out of new profit takes roughly $292,000 in additional annual revenue. That is about $24,000 a month in work you were not doing before, just to pay for the person who lets you leave the building.
Now the second half. Your lead technician was billing hours. At a $140 labor rate and 35 billed hours a week, those hands were producing about $4,900 a week, or roughly $255,000 a year in labor sales. Those are round hypothetical figures, not a benchmark, so put your own labor rate and your own tech's billed hours in their place. Whatever number you get, it leaves the bay the day the promotion starts, unless you backfill first.
Add both halves together before you sign the lease. The management layer is usually the largest single cost of a second location, and it almost never shows up in the pro forma.
Consistency is a customer experience problem, not a paperwork problem
Owners tend to file standardized processes under administration. Customers experience it as trust.
Think about one customer, one repair. They call and get quoted a diagnostic fee. They drop off and get told when to expect a call. They get the call. They approve some work and decline some. They get told the car is ready at a certain time. They pay and leave. That is six separate moments where your shop either does what it said it would do or doesn't.
McKinsey, the management consulting firm, has illustrated what that stack does to satisfaction. If you get each of six interactions right 95% of the time, roughly one in four customers still walks away from the overall experience unhappy, because the misses compound. Ninety-five percent per touchpoint feels excellent. Across the whole visit it isn't.
Now open a second location where those six moments are handled slightly differently, and you have two shops with the same sign producing two different experiences. Customers do not grade you against your other location. They grade you against what they were told last time.
The satisfaction research points at the same pressure point. J.D. Power's 2024 U.S. Aftermarket Service Index study surveyed 10,264 vehicle owners between January and March of that year. Satisfaction in the full-service maintenance and repair segment climbed 12 points on the study's 1,000-point scale, and the firm attributed the improvement largely to service adviser performance and courtesy. The counter is where satisfaction is won. The counter is also the role you stop supervising the day you split your time.
So the process you write down should follow the customer, not the paperwork. Who calls, when, and says what. What gets photographed and sent. What a declined repair triggers, and when somebody follows up on it. Digital vehicle inspection makes a lot of this easier to keep consistent, because a photo and a note travel between locations in a way that a verbal handoff never does, but the standard has to exist before the tool can enforce it.
Staffing gets harder, not easier
There is a version of the second-location plan where scale solves hiring. Two shops, bigger name, better candidates. It rarely plays out that way, because you are now competing for technicians in a market that is short on them and you have twice as many seats to fill.
The TechForce Foundation, a nonprofit that tracks technician supply and demand using federal completions and employment data, projected in its 2024 report that the transportation industry would need an estimated 971,000 new technicians between 2024 and 2028 across automotive, diesel, collision, and aviation. Be precise about what that figure is. It is projected demand across four sectors over five years, and it is driven mostly by replacement as people retire and leave rather than by growth. TechForce found replacement needs outpacing growth by more than four to one in the automotive, diesel, and collision segments. It is not a count of open jobs today. What it does establish is that the pipeline is structurally tight, and that your second location is hiring into that.
Retention matters more than recruiting here, and retention is a management problem. WrenchWay, an industry platform that surveys technicians alongside the National Institute for Automotive Service Excellence, reported in its 2025 Voice of the Technician survey of roughly 5,000 respondents that about three in 10 technicians never sit down with their manager individually at all, while another three in 10 do it weekly. The same survey found 67% of technicians calling paid training a must-have, about two in three, while only 51% said their shop provides it, or about half. Those respondents opted into the survey themselves, so the sample skews toward technicians engaged enough to answer, and the percentages should be read as signal rather than census.
Still, the signal is worth taking seriously. Weekly touchbases and paid training are both things that quietly stop happening at the location the owner visits least.
What to standardize first, and what to leave alone
Standardize the things where variation costs money or trust:
The customer communication sequence, from first call to pickup. Diagnostic and estimating procedure, including what has to be documented before anything gets quoted. Quality control before a car goes back to the customer, since a returned vehicle at your new location does more damage to your name than one at your established shop. Pay plans and how production is measured, because two different pay structures across two locations will eventually put your own technicians in competition with each other. Training expectations and certification targets.
On that last one, the National Institute for Automotive Service Excellence, known as ASE, gives you a ready-made standard instead of one you have to invent. Its Blue Seal recognition requires at least 75% of a shop's service staff to hold ASE certification. Whether or not you pursue the recognition, three out of four certified is a target both locations can be measured against.
Leave alone the things that are local and cost you nothing:
Shop hours that fit the neighborhood. The mix of work, since a location surrounded by fleet accounts should not be forced into the same job mix as one surrounded by commuters. Vendor relationships where a local supplier genuinely delivers faster. How the manager runs the morning meeting.
The distinction is straightforward. Standardize the promise. Localize the logistics. Owners who standardize everything build a system nobody at the second location believes in, and the process gets quietly abandoned the first busy week.
How to tell whether location two is working
Compare the two shops on the same measures, same week, and look at the gap rather than the totals:
Gross profit percentage on labor and on parts, tracked separately for each location. Technician efficiency, meaning the number of billed hours divided by hours worked. Percentage of recommended work that gets approved. Returned vehicle rate. Average days from a declined repair to a follow-up contact.
The point of running them side by side is that a gap tells you something a total never will. If location two sells 38% of the work it finds and location one sells 55%, that is not a market difference, it is a process difference, and it is fixable. On a shop finding $1,200 of work a day, those 17 points are about $200 a day walking out the door, or roughly $4,000 a month.
One more measure, and it is about you. Count the days you spent at each location last month. If the answer is that both shops needed you, the process you needed to write down before opening still isn't written.
FAQ
How long before a second location is profitable? There is no credible published figure specific to repair shops, so be skeptical of anyone who quotes one. For general context, federal Business Employment Dynamics data shows about half of all new business establishments surviving five years, with 51.4% of the establishments that opened in March 2020 still operating five years later. That covers all industries and all new establishments rather than second locations specifically, so use it as a reminder that new sites are fragile, not as a forecast for yours.
Should I promote a technician or hire an outside manager? Both work. The mistake is treating the promotion as automatic because someone is your best producer. Managing is a different job, and Gallup's research suggests a minority of people are naturally suited to it. If you promote internally, budget for real management training and expect to coach weekly for the first year.
What is the single most important thing to standardize before opening? Customer communication. It is the process customers actually experience, it is the one J.D. Power's research ties most directly to satisfaction, and it is the easiest to get wrong when a new service adviser is improvising under pressure.
Do I need the same software and systems at both locations? You need the same definitions. If technician efficiency, approval rate, and gross profit are calculated differently at each shop, you cannot compare the two, and comparison is the only way you will find out which location has a problem.
Can I run two shops without a full-time manager at one of them? Some owners do it for a while, usually by splitting weeks and leaning hard on a strong service adviser. It works until something breaks at both locations in the same week. Plan the management layer as a cost of opening, not as a reward for succeeding.

Technician Life & Careers
How Much Should an Auto Repair Shop Pay Technicians?
A practical breakdown to technician wages, pay models, and the retention math behind them
You can build the cleanest bays in town, buy the best tools, and still lose the person you spent 18 months training because another shop down the road offered another $2 an hour. Pay is not the only reason technicians stay or leave, but it is the thing every other conversation eventually circles back to. And right now, getting it right is harder and more consequential than it has been in years.
This piece lays out what the data says technicians actually earn, how the major pay models change a technician's paycheck and your shop's economics, and how to think about compensation when the labor pool is this tight.
What do auto repair technicians actually earn?
The national baseline is easier to pin down than most owners assume. According to the U.S. Bureau of Labor Statistics, the median annual wage for automotive service technicians and mechanics was $50,620 in May 2025, or $24.34 per hour. Half the workforce earned more than that, and half earned less.
The median range matters a lot. In the BLS data, 25 percent earned below roughly $38,900, and 25 percent earned above roughly $70,430. That is a wide band, running more than $47,000 in range, and changes depending on experience, certifications, specialization, and the kind of shop technicians work in.
Shop type is a bigger factor than many owners expect. BLS data shows most technicians work in one of two settings. Automobile dealers employ the largest share, about 264,000 of them nationally, followed closely by automotive repair and maintenance shops at about 252,000. A smaller group, roughly 49,000, works for automotive parts, accessories, and tire retailers. Dealers have long tended to pay at the higher end of the range and general auto repair shops are somewhere in the middle, which is part of why strong auto repair shops must compete on more than a base wage.
Read the size of that band as a competitive map. The technician weighing an offer from you is somewhere on a spectrum that stretches past $80,000 at the top, and the shop down the road knows it, too. The wage is where the conversation starts.
Why technician pay is climbing
The short version: there are not enough technicians, and the math is not improving on its own.
Across the transportation and skilled-trade sectors it tracks, the TechForce Foundation reports the country needs about 241,842 new entrant technicians each year, against roughly 101,743 students graduating from technical schools and community colleges, meaning supply meets barely 42 percent of demand. For automotive specifically, the picture is a little better but still lopsided. TechForce reports 70,865 annual openings for automotive technicians against a projected supply of 50,085, leaving a gap of about 20,780 technicians per year, with supply covering only 59 percent of annual demand.
The federal projections point the same way. The U.S. Bureau of Labor Statistics projects that employment of automotive service technicians will grow 4 percent from 2024 to 2034, with about 70,000 openings each year over the decade, many of them driven by the need to replace workers who retire or leave the field.
Here is the part that changes how you should think about pay. The shortage is less a recruiting problem than a retention problem. Across the sectors TechForce studied, employers hired 1.18 million technicians in 2025 and lost 1.14 million in the same year, a net gain of only about 32,450 workers. The industry is running the hiring treadmill at full speed and barely moving forward. Every technician who walks out the door is one you have to replace at market rate, on top of the productivity you lose while the bay sits empty.
That reframes the compensation question. You are not just setting a wage. You are setting the price of keeping someone, and the alternative to paying it is paying to recruit, hire, and retrain their replacement, usually for more.
The three pay models, and what each one actually rewards
Most shops pay technicians one of three ways, or some blend of them. Each sends a different signal and creates a different set of incentives. The right choice depends on what your shop needs more of: predictability, throughput, or the ability to recruit against a specific competitor.
Hourly pay
The technician is paid for every hour they are clocked in, whether they are turning a wrench, waiting on a part, or sweeping the bay.
The advantage is stability, for both sides. The technician knows exactly what the check will say, which matters enormously to a younger technician deciding whether this trade can support a mortgage. The shop gets predictable labor costs and a workforce that is not incentivized to rush. That last point is underrated: an hourly technician has no financial reason to cut a corner on a brake job.
The tradeoff is that hourly pay does not reward speed or skill directly. Your fastest, most capable technician earns the same rate whether they book six hours of work in a day or 11. Over time, that can frustrate your best people and quietly subsidize your slowest.
Flat rate
Flat rate pays the technician a set number of hours for each job, based on a standard labor guide, regardless of how long the job actually takes. Replace an alternator booked at 2.0 hours in 90 minutes, and the technician still gets paid 2.0 hours, then moves to the next job. A skilled, fast technician can beat the book and earn well above their nominal hourly rate.
Flat rate is the model most closely associated with high earners, and for good reason. It rewards exactly the thing a busy shop needs: efficient, high-quality work that clears the board. Your best technicians tend to love it, because it uncaps their income.
The risks are real, though, and worth naming plainly. When the shop is slow, a flat-rate technician's income drops even though their bills do not, which is a fast way to lose good people during a soft month. Flat rate can also pressure technicians toward speed over thoroughness if the culture and quality controls are not strong. And it can penalize the technician for problems that are not their fault: a seized bolt, a wrong part, a returned vehicle that has to be redone off the clock. A shop running flat rate well usually pairs it with a base guarantee and a genuine commitment to keeping the schedule full.
Salary plus commission or bonus
A base salary provides a floor, and a commission or performance bonus rewards output above it. This hybrid is increasingly common because it tries to capture the best of both: the stability that keeps people from leaving and the upside that keeps them motivated.
The catch is complexity. A plan like this only works if the technician understands it, believes it is fair, and can see how their daily choices move the number. A bonus structure nobody can explain is just a salary with extra paperwork, and worse, it can breed suspicion that the math is rigged against them.
There is no universally correct answer among the three. The best pay method for an entry-level technician is often a straight hourly or salaried wage because predictability recruits and retains people who are still deciding whether to commit to the trade. The best method for a seasoned top-tech is often a flat rate or a salary-plus-production hybrid because those uncap earning power for someone who has the speed to use it. Some shops run more than one model at once, aligning each role to where technicians are in their careers.
How to set a number for your shop
The national median tells you where the market is. It does not tell you what to put in an offer. To get to a real number, work through four questions in order.
Start with your local market, not the national median. Wages swing hard by region and metro area. The BLS publishes state and metro wage data through its Occupational Employment and Wage Statistics program, and that local figure, not the national one, is what your candidate is comparing you against. A number that looks generous nationally can be uncompetitive in a high-cost metro area.
Price the role by experience and certification. An entry-level lube technician, a mid-level general-service technician, and a master diagnostician are three different jobs with three different market rates. Certification is part of that pricing. Industry certifications signal verified competence, and the BLS notes plainly that having industry certifications demonstrates competence and may bring higher pay. Certified technicians expect to be paid for the credential, and treating certification as a raise trigger gives your people a concrete reason to pursue it, which raises the capability of your whole bay.
Check the number against what the technician can bill. A wage only works if the hours that technician produces cover it with margin to spare. Here is the simple version. Say you pay a technician $30 an hour and they bill 32 hours of labor in a 40-hour week at a $150 door rate. That seat brings in $4,800 in labor for the week, against a wage cost of $1,200. The gap has to cover a lot more than the wage: payroll taxes, benefits, the tools and lift, rent on the bay, and your profit. Now run the same math on a technician who bills only 20 hours a week, and the picture tightens fast. The lesson is that the wage you can afford is tied directly to how many billable hours the seat actually produces, so figure out that number before you make the offer, not after.
Add the cost of the alternative. Before you decide an offer is too high, price out the alternative. What does it cost to leave the bay empty for the weeks it takes to find someone? What does it cost to recruit, onboard, and retrain a replacement, and to absorb the mistakes of someone learning your systems? When you put a real number on turnover, a higher wage for a proven technician often turns out to be the cheaper option.
Pay is a piece of the puzzle, not the whole game
Here is the uncomfortable truth for owners trying to win on wage alone: you probably cannot, and you may not have to.
Because the shortage is driven so heavily by retention, the shops pulling ahead are the ones treating pay as the price of admission and then competing on everything else. The list is not exotic. Industry analysts covering the TechForce shortage data point to the same durable factors again and again: competitive pay, modern equipment, benefits, training access, clear advancement, and a culture that respects the work.
Notice that only one of those six is the wage itself. The other five are things a well-run auto repair shop can offer as readily as a dealer, sometimes more readily. A technician who has to buy their own tools, wait on parts, fight outdated equipment, and see no path to the next level will leave for $2 an hour. A technician who is paid fairly, equipped properly, trained continuously, and shown a real path to master tech or shop lead has far less reason to answer the recruiter's call.
That is the strategic point buried in the pay question. Wage gets you into the conversation. Everything around the wage is what keeps you from having the same conversation again in eight months with a new hire.
Frequently asked questions
What is the average pay for an auto repair technician? The median annual wage for automotive service technicians and mechanics was $50,620 in May 2025, about $24.34 per hour, according to the U.S. Bureau of Labor Statistics. The middle half of technicians earned between roughly $38,900 to $70,430. Local wages vary widely, so check your state and metro figures through the BLS Occupational Employment and Wage Statistics program.
Is flat rate or hourly better for technicians? Neither is universally better. Flat rate rewards speed and skill and tends to produce the highest earners, but it exposes the technician to income swings when work is slow. Hourly pay offers stability and removes any incentive to rush, but it does not directly reward a technician's efficiency. Many shops use hourly or salary for entry-level and less experienced technicians and a flat rate or a hybrid pay model for seasoned ones.
How much should I pay an entry-level technician? Entry-level pay sits toward the lower end of the national range, where the lowest 10 percent of technicians earned about $34,660 in May 2025. For newer technicians, a predictable hourly or salaried wage is often more effective at recruiting and retaining than a flat-rate plan because stability matters most to someone still deciding whether to stay in the trade. Price the specific role against your local market rather than a national figure.
Why is technician pay rising so fast? Demand for technicians far outstrips supply. The TechForce Foundation reports that for automotive specifically, supply covers only about 59 percent of annual demand, a gap of roughly 20,780 technicians a year. When qualified people are scarce and turnover is high, wages climb as shops compete to attract and keep them.
Do certifications increase a technician's pay? They can. The BLS notes that industry certifications demonstrate competence and may bring higher pay, and many shops tie certification directly to raises. Beyond the individual paycheck, building a certified team raises the diagnostic and repair capability of the whole shop.
Is raising pay enough to keep technicians? Usually not on its own. Because the shortage is driven heavily by retention, the factors that keep technicians tend to include, according to industry analysis of the TechForce data, competitive pay, modern equipment, benefits, training access, clear advancement, and a workplace culture that respects the work. Pay gets you into the running; the working conditions are what keep a technician from leaving.
Title tag: How Much Should You Pay Auto Repair Technicians?
Meta description: What auto repair shops should pay technicians, with current BLS wage data, a breakdown of flat rate vs. hourly vs. salary, and the retention math behind the number.
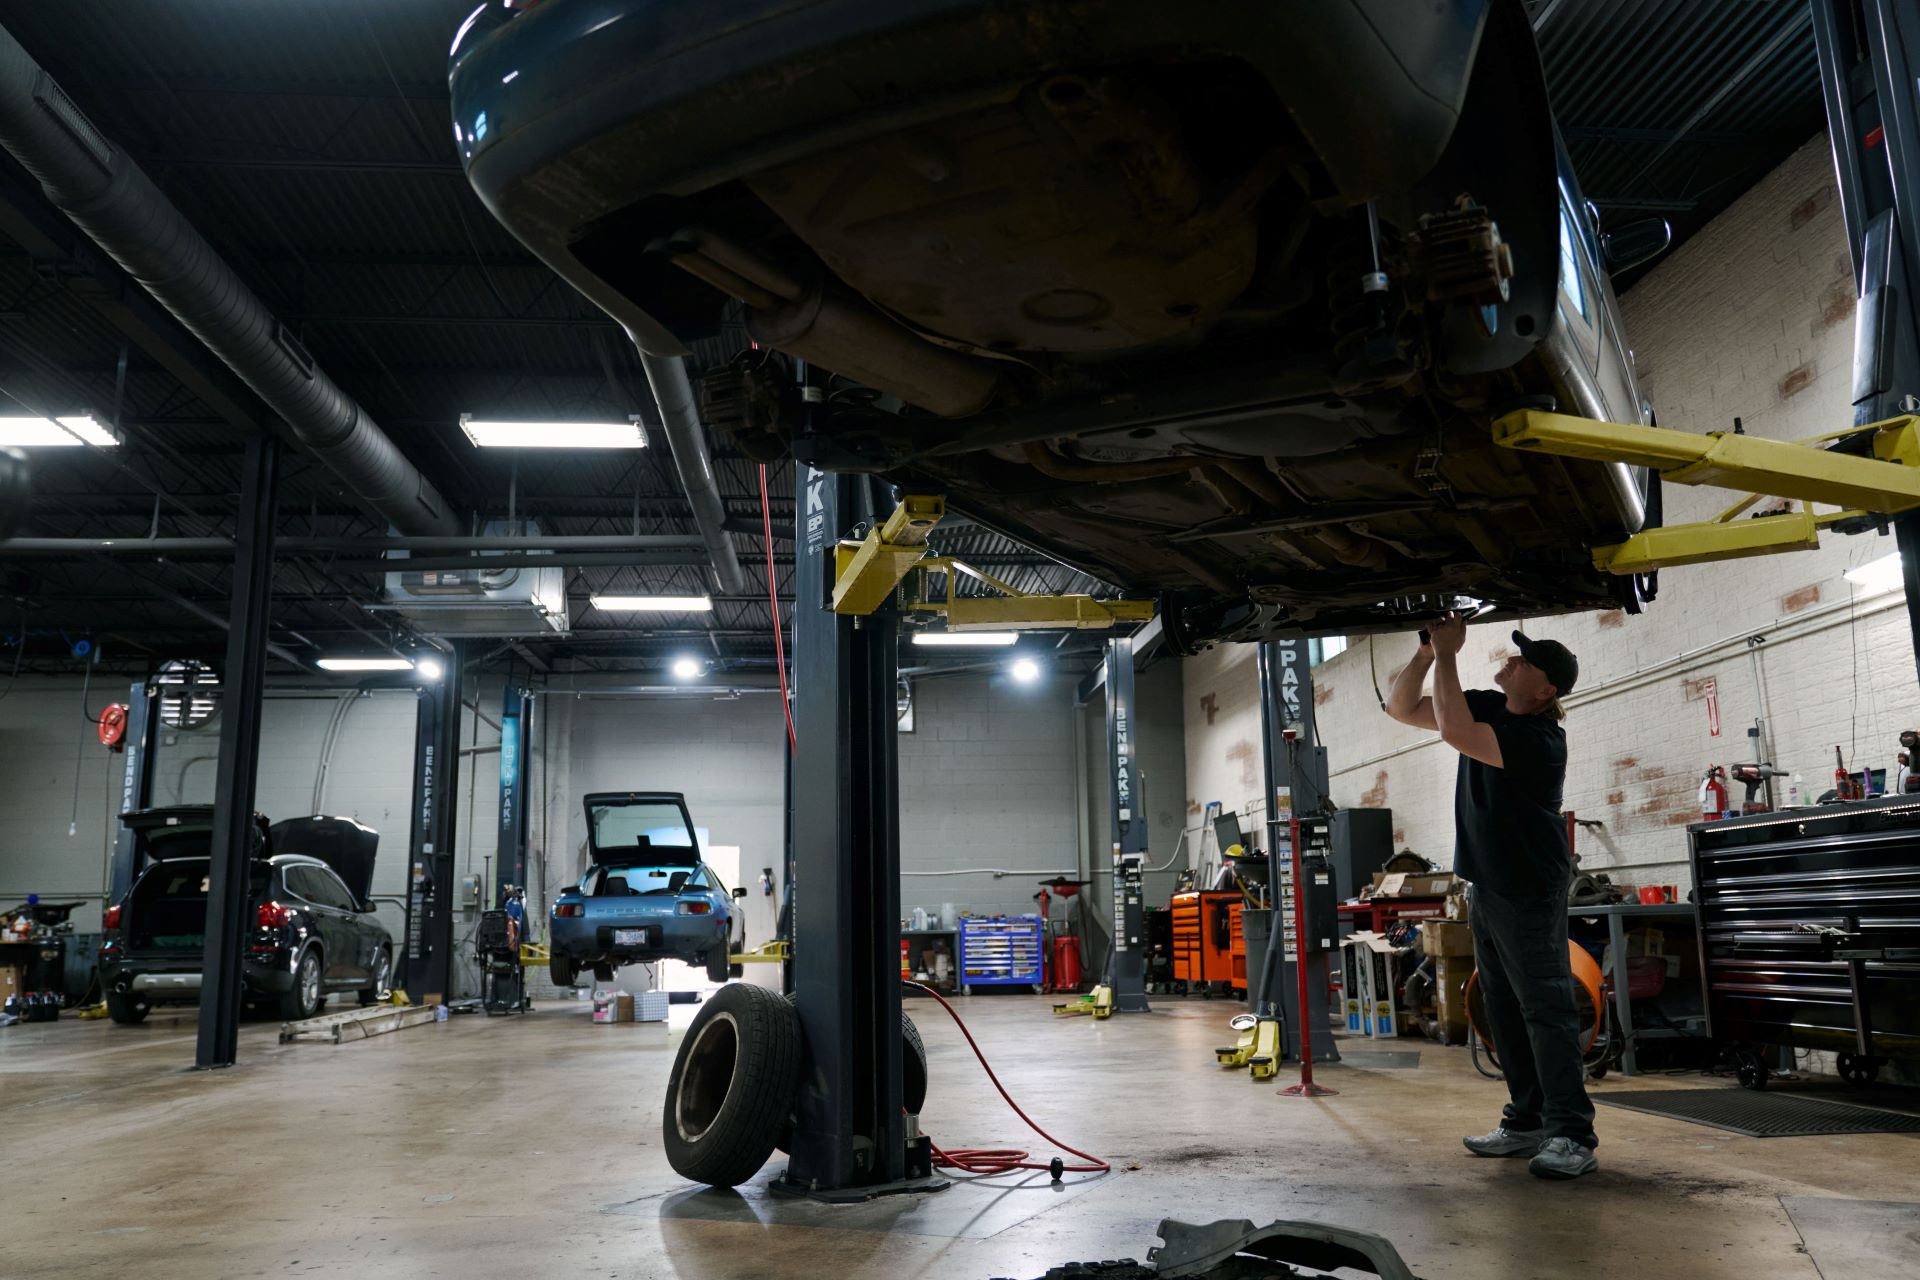
Technician Life & Careers
The Retention Gap: Why Auto Repair Shops Lose Technicians Faster Than They Hire Them
Benjamin Johnson
A shop owner spends four months recruiting a solid technician. The shop invests in relocating the technician, paying a signing bonus, and providing two weeks of training before the new hire is billing real hours. Fourteen months later, that technician gives notice and takes a job across town for roughly the same pay. The owner is now forced to start hiring all over again.
That situation plays out every week, and it exposes what most shops get wrong. They treat labor issues as a hiring problem. It isn't. Shops are losing trained technicians as fast as they hire them because they aren’t focusing on the technician experience. Recruiting fills the bucket, but retention is the hole in the bottom.
The math the shortage hides
The headline number is real. The TechForce Foundation's 2026 Supply, Demand and Opportunity Report found that new-technician supply meets only 59 percent of annual demand in the automotive sector. Across the 10 technician sectors it tracks, the country needs 241,842 new entrants a year while schools graduate 101,743. The training pipeline covers barely 42 percent of demand.
That sounds like a recruiting story: not enough graduates, so hiring is harder. But the same report makes a quieter point that changes the whole picture. Most of the demand is not coming from industry growth. It comes from the need to replace technicians who leave.
The replacement data backs that up. The Auto Care Association's 2025 Auto Care Factbook found that almost 30 percent of technicians leave their jobs each year, and that half of all entry-level technicians from certified programs leave their jobs within two years. Put those two facts side by side. Schools cannot produce enough graduates to cover demand, and half of the graduates who do arrive are gone inside 24 months. A shop can win every hiring battle it fights and still end the year down a technician.
Why technicians actually leave
Pay is the reason owners reach for first, and pay matters. But when former technicians are asked directly, the list of reasons runs longer than the paycheck, and most of what shows up is inside a shop owner's control.
The recurring themes are consistent across surveys and exit interviews: unpredictable or opaque pay, dispatch practices that quietly cap what a technician can earn, no visible path to advance, tools and equipment that make the work harder than it needs to be, and managers who only show up when something goes wrong. WrenchWay's Voice of the Technician survey has surfaced the same pattern for years, with a large share of technicians leaving in their first five-to-seven years because they see better pay, benefits, and a future somewhere else.
Notice what most of those have in common. They are not market forces. They are operating decisions. A technician who cannot predict this week's paycheck, who watches the good jobs get dispatched to someone else, and who cannot name the next rung on the ladder is a technician already halfway out the door, no matter what the hourly rate says.
The first 90 days decide more than you think
Turnover within the first three months of hiring a technician is a problem because it wastes money and time. Shops see the pattern: a hire who looked great in the interview is gone before the next quarter is done.
The cause is rarely the technician. It is an onboarding vacuum. A new hire is handed a bay, pointed toward the parts counter, and left to reverse-engineer how a shop actually runs, where the diagnostic equipment lives, how repair orders move, and who to ask when a job goes sideways. Nobody checks in. By week three, the new technician has quietly decided this place is disorganized and is looking to leave.
The fix to that costs almost nothing. Assign every new hire a specific person to shadow for the first two weeks. Write down how a repair order flows through the shop so no one has to guess. Schedule a real conversation at day 30, day 60, and day 90, to ask how it is going and fix what isn’t working before frustration turns into a resignation. Shops that treat the first 90 days as a structured handoff instead of a sink-or-swim test keep people who would otherwise have walked away.
Advancement is the lever most shops leave untouched
A career that feels like a ceiling pushes good people toward any shop, dealer, or trade that shows them a next step.
Advancement does not require inventing management jobs that do not exist. It requires making growth visible and connecting it to money. Build a skill ladder that lays out what separates an entry-level technician from a mid-level one from a master, and attach a specific pay increase to each rung. Cover the cost of ASE certification and give technicians paid time to study for it, so certification becomes a shop investment instead of a personal expense taken on nights and weekends. Let senior technicians mentor newer ones and pay them for the time, which both develops the bench and tells your best people they are valued for more than flat-rate speed.
The point is that a technician needs to be able to see the path and see the raise waiting at the end of it. A ladder that is honored consistently keeps more people in bays than a bonus nobody saw coming.
Culture is not a poster, it is how the work feels
Culture is the vaguest word in this conversation and the most concrete thing a technician experiences every day. It is whether the shop is clean and the air conditioning works in July, and whether the diagnostic scanner is current or three model years behind. It is whether dispatch is fair, or whether the same two technicians always land the gravy jobs. And it is whether a manager notices when someone has had a hard week.
None of that shows up on a values statement, and all of it shows up in a resignation. A shop that expects fast, quality work but hands technicians outdated equipment and an unpredictable schedule is teaching its best people to look elsewhere. The shops that hold onto technicians tend to get the unglamorous things right: the equipment works, the schedule is honest, the jobs are handed out fairly, and appreciation is a habit rather than an annual event.
What this means for the shop owner
The recruiting market is genuinely tight, and it is not loosening soon. That is exactly why retention is the higher-leverage place to spend attention. Every technician a shop keeps is one it does not have to spend four months and a signing bonus to replace, and one who is not going to a competitor down the road.
The levers are not exotic:
- Make pay predictable and dispatch fair
- Treat the first 90 days as a real handoff
- Draw a visible ladder and connect it to money
- Pay for certifications
- Keep the equipment current
- Keep the schedule honest
Frequently asked questions
Is the technician shortage a hiring problem or a retention problem? Both, but the data points more toward retention. The 2026 TechForce Foundation report shows automotive supply meeting only 59 percent of annual demand, and most of that demand comes from replacing technicians who leave rather than from industry growth. A shop that keeps its people needs to hire far less often.
How many technicians leave the industry each year? The Auto Care Association's 2025 Auto Care Factbook found that roughly 30 percent of technicians leave their jobs each year, and that half of entry-level technicians from certified programs leave within their first two years.
What is the single biggest driver of technician turnover? There is no single driver, but the reasons that come up most often are within a shop's control: unpredictable or opaque pay, unfair dispatch, no visible path to advancement, poor equipment, and disengaged management. Pay transparency and a clear career path consistently rank near the top.
How can a shop reduce early technician turnover? Structure the first 90 days. Assign a person for new hires to shadow, document how the shop actually runs, and hold real check-ins at 30, 60, and 90 days to fix small frustrations before they become resignations.
Does raising pay fix retention on its own? No. Competitive, predictable pay is the entry ticket, but technicians who leave often cite advancement, management, and working conditions alongside pay. A raise without a visible career path and a workable day-to-day tends to delay a departure rather than prevent it.
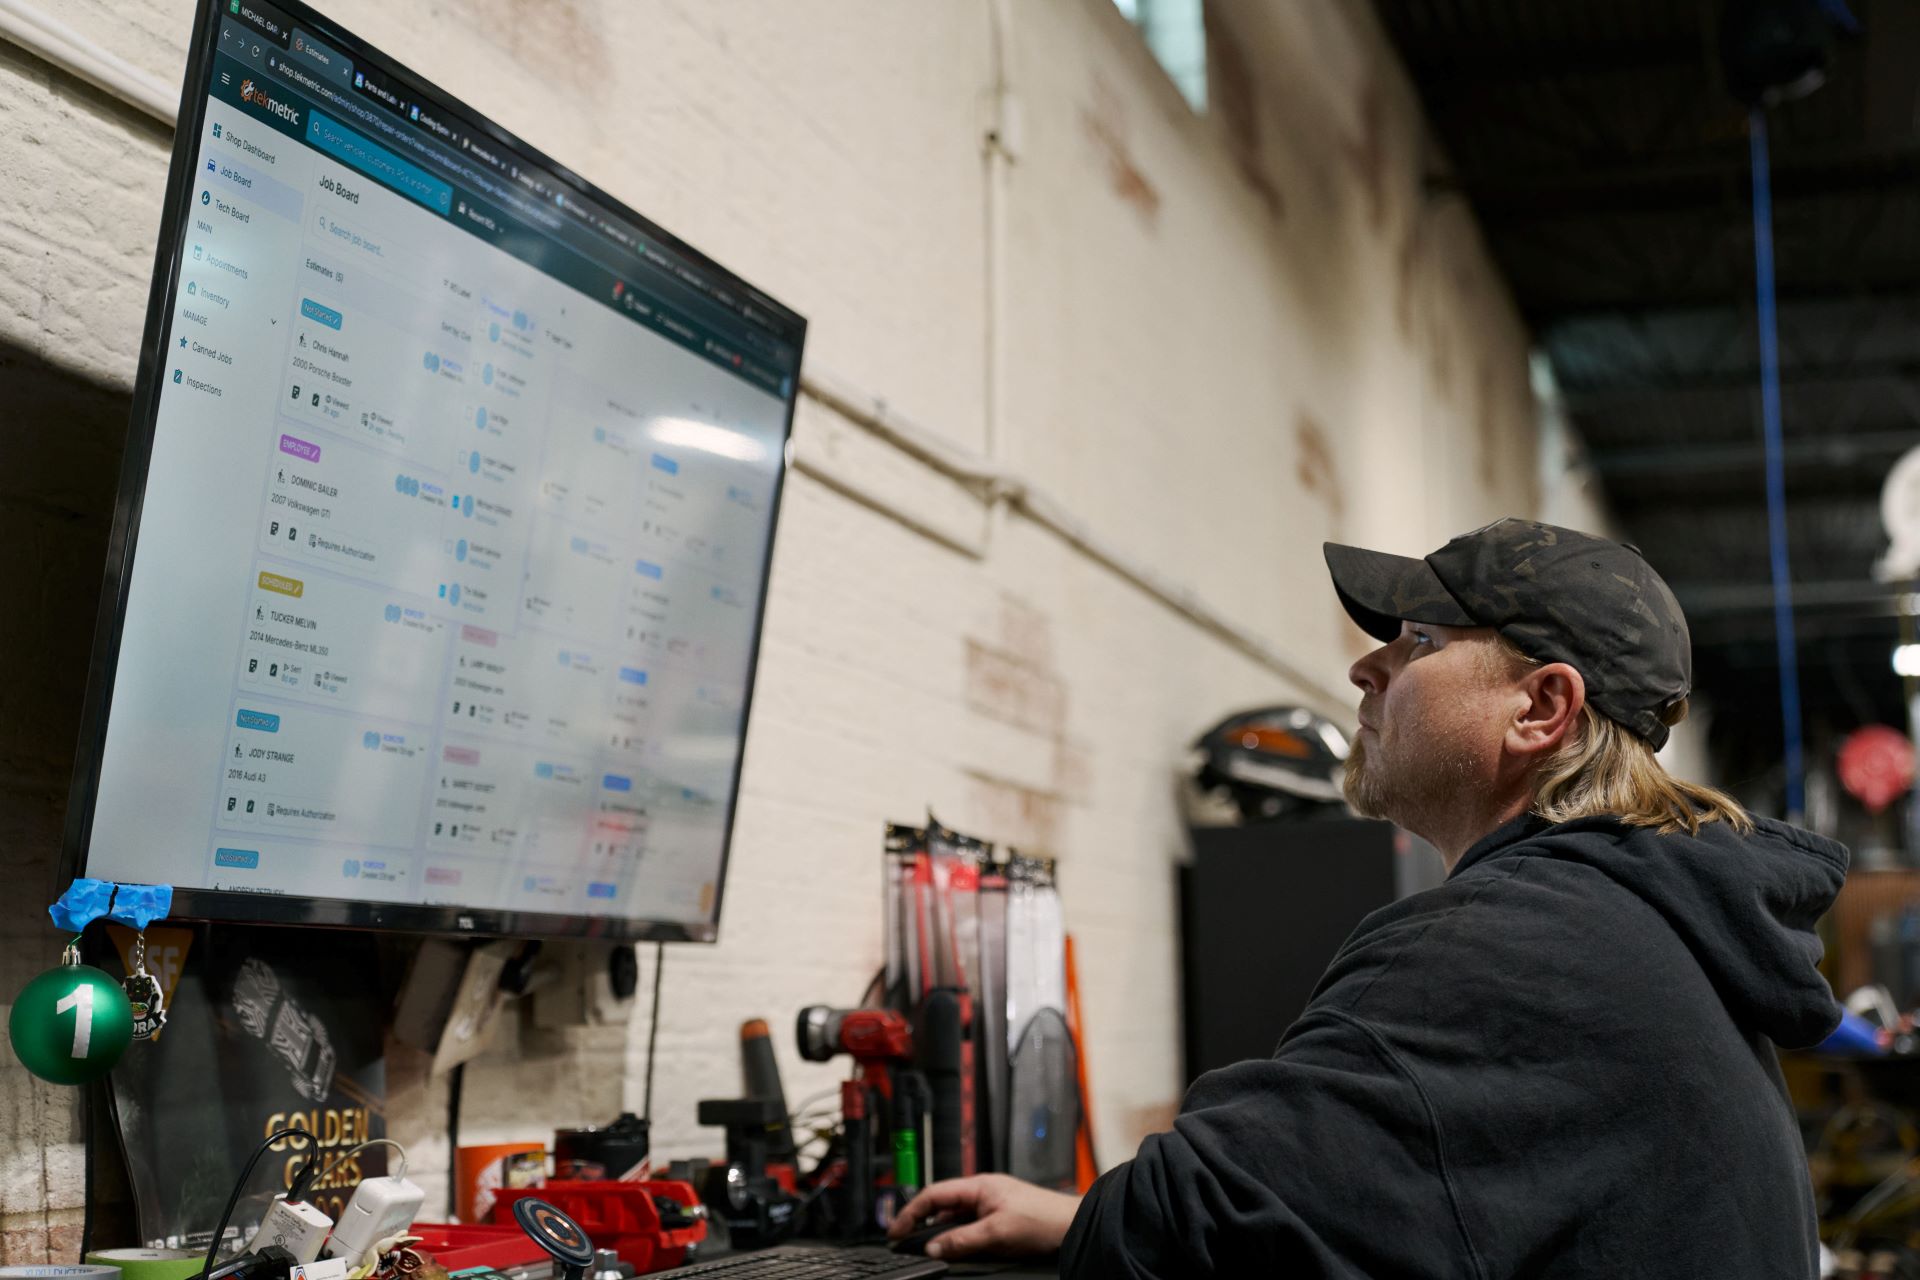
Technician Life & Careers
Measuring Technician Efficiency Without Breaking Trust in the Bay
Benjamin Johnson
Efficiency, productivity, and proficiency all come off the same timecard, but they answer three distinct questions about technician performance. Auto repair shops that track all three know whether a slow week was caused by a technician, dispatch, parts orders, or a combination of all three.
Good technicians treat performance tracking as coaching and improve over time. And that is one major difference between top-performing shops and ones with empty bays.
The work technicians perform also has changed substantially in the past few years. Advanced driver-assistance calibrations appeared on less than 1% of repairable appraisals in 2017 and accounted for more than 23% of work by 2025, according to CCC Intelligent Solutions, a leader in the auto claims and collision repair industry. It represents just one of the technological changes technicians face as they try to succeed at auto repair shops.
Here is how to measure performance in a way technicians will trust.
What is technician efficiency, and how is it different from productivity?
Most shops use these words interchangeably. That is where the trust problem starts. If a technician cannot explain the formula behind their own performance number, the number reads as a judgment instead of a measurement.
Here is what each one actually measures.
Productivity is the number of hours worked divided by hours available. A technician that clocked in for 40 hours but only had cars in the bay for 26 of them is running at 65% productivity. That is a scheduling issue, not a problem with technician performance.
Efficiency is the number of billed hours divided by hours worked. This allows shop owners to evaluate technician performance. Three billed hours completed in two hours is 150% efficiency on that job.
Proficiency is the number of billed hours divided by hours available. What did a technician produce across the whole week, start to finish? This metric combines the other two and it is the closest thing to a single honest number.
Read together, these three tell you something a single number never will. A technician at 130% efficiency and 60% productivity is not a problem employee. That points to a dispatch problem, a parts problem, or a scheduling problem, and those issues belong to management.
Shop owners usually want a target number, but it is worth noting most trace back to dealership service management guidance, which was built around a different work mix. That makes your own work history the better yardstick. Compare a technician against their previous 12 months of work for a more accurate assessment of their performance.
Efficiency is mostly in the technician's control and productivity is mostly yours.
Why do technicians distrust performance metrics?
Post a whiteboard in the bay ranking technicians by billed hours, and the incentives go sideways fast. The quick diagnostic tech starts steering around hard jobs. The A-tech stops walking over to help the apprentice. Returned vehicles are quietly re-repaired off the clock because nobody wants their name next to one.
In this case, the numbers are not the problem; the setting is.
WrenchWay and the National Institute for Automotive Service Excellence
(ASE) asked 5,511 technicians whether they would recommend this career to someone else. Far more said no than yes, and the gap has widened sharply in each of the past three years, with automotive technicians more sour on the trade than the field as a whole.
The rest of the survey shows where the frustration points:
- A staggering 77% do not believe the industry is improving
- Only 44% feel valued and respected by management
- Only 33% say management communicates well
- Only 26% see a clear career path where they work
A technician who already believes management does not communicate well is not going to read a productivity report as coaching. They will read it as the paperwork that precedes a pay cut.
In its State of the Global Workplace report, Gallup found that managers account for roughly 70% of the variance in team engagement, meaning the metrics used to measure technician performance do not build or break trust. The person delivering it does.
Where time breaks down
Here is the objection every technician will raise, and it is a legitimate one: the standard shop owners are measuring them against was not written for the work they are actually doing.
Flat rate was built roughly a century ago to standardize the cost of repairs that were largely mechanical and largely predictable. The work rolling into bays today is different than it was even five years ago. The average U.S. light vehicle hit a record 12.9 years old in the Auto Care Association's 2027 Factbook. Older vehicles bring intermittent electrical faults, corroded fasteners, and diagnostic work that does not follow a script.
Then, there is calibration. Advanced driver-assistance systems have moved from novelty to routine. CCC Intelligent Solutions reports that calibrations appeared on 0.9% of repairable appraisals in 2017 and on more than 23% by 2025, with average calibration fees nearly doubling in five years to about $500.
That work is coming whether shops plan for it or not. CCC points to NHTSA's rule requiring automatic emergency braking on all new passenger cars and light trucks by September 2029, which means calibration-heavy vehicles will keep aging out of warranty and into aftermarket bays.
The emergence of electric vehicles also contributes to the changing nature of work that auto repair shops must incorporate. EVs made up about 2.54% of vehicles on the road by the first quarter of 2026, according to the Alliance for Automotive Innovation. That number is expected to grow.
The point is not that book time is worthless — it is that a technician measured strictly on beating book time will avoid exactly the work that is growing fastest. Diagnostics and calibration punish the scoreboard. Brake jobs reward it.
If you have not priced diagnostic time honestly, you have no business measuring efficiency. Fix the pricing first.
How should a shop measure technicians fairly?
Here are five practices that separate measurement that motivates from measurement that alienates.
Publish the formula before you publish the score. Write down which of the three ratios you use, what counts as available hours, and how lunch, training, and shop cleanup are treated. A technician should be able to easily calculate their own number.
Separate what the technician controls from what you control. Track efficiency and productivity as two different lines. When productivity dips, the first conversation is with the service advisor and the parts counter, not the technician. Shops that skip this step teach their best people that the scoreboard is rigged.
Measure quality and speed. A returned vehicle generates nothing. If your only metric rewards speed, you are paying for rush jobs and absorbing the cost of rework. Additionally, this impacts the customer experience.
Carve out diagnostics and calibration. Bill this work by the hour rather than against book time, and leave additional hours out of the efficiency calculation. Otherwise, the math punishes the technician for doing the job right. An intermittent electrical fault that the labor guide calls one hour can honestly take three, and the technician who chases it down lands under 35% efficiency for the effort. Do that twice and your best diagnostic tech learns to let someone else take those cars.
Use the numbers in weekly touchbases. A weekly conversation about one technician's performance does more than a public ranking on a board ever will. Rankings create competition for the easy jobs. Coaching creates capability.
Does technician pay have to change, too?
Often, yes, and technicians are telling us what they want.
In the 2026 WrenchWay and ASE Voice of Technician survey, 41% of technicians said they want an hourly or salary base paired with a production bonus. A year earlier, that number was 25%.
Read that shift carefully. Technicians are not asking to stop being measured. They are asking for a floor under the measurement. Paying nothing for the hours a technician spends waiting on your parts order is the fastest way to convince a good technician that the scoreboard exists to protect you, not them.
Frequently asked questions
What is a good technician efficiency percentage? There is no verified industry standard for aftermarket repair shops. The round numbers that circulate online generally trace to dealership service management guidance, where the work mix differs, or to marketing content with no survey behind it. Evaluating technician performance against the past 12 months is a more useful benchmark than any outside average because it accounts for your car count, your labor guide, and your parts supply.
What is the difference between billed hours and actual hours? Billed hours are the labor hours a repair order charges the customer, set by the labor guide. Actual hours are the clock hours the technician spent on the job. Efficiency is the number of billed hours divided by hours worked. A technician who completes a three-hour job in two hours is running 150% efficiency on that job.
Should technicians see their own efficiency numbers? Yes, and they should see them before anyone else does. A number a technician can check, question, and correct is a coaching tool. A number that appears in a meeting without warning is a disciplinary document.
How do you measure diagnostic work fairly? Track it separately from book-time production and price it as its own billable service. Diagnostic time does not conform to labor guide estimates, and measuring it against them pushes technicians away from the work.
Does flat-rate pay hurt technician retention? Survey data shows technicians increasingly prefer a base-plus-bonus structure over straight flat rate. In the 2026 Voice of Technician survey from WrenchWay and ASE, 41% chose hourly or salary plus a production bonus, compared with a quarter choosing straight hourly or salary. The issue is less flat rate itself than income volatility caused by factors technicians cannot control.
How many technicians does the industry need each year? TechForce Foundation's 2026 Technician Supply, Demand, and Opportunity Report projects 70,865 annual automotive technician openings against 50,085 in annual supply, leaving a gap of 20,780 per year.

Technician Life & Careers
The Trade School Pipeline: Tap Local Programs for Your Next Hire
Benjamin Johnson
Automotive program completions are at their highest level in more than a decade. The shops that recruit those graduates win.
Ask any instructor at your local automotive repair program where this year's students are going after graduation and they will know. Those decisions were made months ago, often in favor of the shops who take part in automotive repair education programs.
Owners who sit on advisory committees, donate tools, or who spend an hour in front of a class have an advantage because they are tapping the next generation of talent.
This matters more than it did previously because the pool of graduates is increasing. Completions at U.S. postsecondary automotive programs reached 41,726 in the 2023-2024 academic year, a 10.9% increase over the prior year and the third straight year of growth, according to the TechForce Foundation, a nonprofit that tracks technician supply and demand using federal education data.
That is the most automotive graduates the industry has produced since 2012. If you have been posting jobs and waiting for people to apply, you’re already behind the curve. You are competing against owners who made themselves known to the next generation of technicians.
The technician shortage gap remains
Growth does not mean the technician shortage is over.
The U.S. Bureau of Labor Statistics, the federal agency that produces the country's employment data, projects about 70,000 openings a year for automotive service technicians through 2034. TechForce, a nonprofit organization that supports technicians through their careers, calculates that current automotive training output covers 59% of annual demand. Over five years, the foundation puts the automotive shortfall at a whopping 354,323 technicians.
Even though the pool grew, it is still not enough to fix the technician shortage. Every new technician has choices, and the real question is whether your shop is one of them.
Here are a few practical tips for improving your technician pipeline.
Step 1: Join a local auto repair program's advisory committee
Joining an advisory committee costs nothing and is the single highest-return move available to you.
Automotive programs accredited by the ASE Education Foundation, the accrediting arm of the National Institute for Automotive Service Excellence, are required to run a local advisory committee. The standards call for a minimum of five members meeting at least twice a year. That committee reviews the program's facility, equipment, and task list, and it rates the program against the accreditation standards.
This is an opportunity for local shops to introduce themselves to the next generation and build a solid talent pipeline.
The ASE Education Foundation works with more than 2,300 automotive training programs nationally. To find yours, call the automotive instructor at your nearest high school career center or community college and ask when the advisory committee meets and ask to attend the next one.
Step 2: Give schools something they can use
Instructors are not looking for a check. They are looking for the things a school budget will not cover.
Start with a work-based learning slot, meaning a student is placed in your bays for a semester, supervised, doing real repair orders. Equipment helps, too. Scan tools, a running engine, or a late-model vehicle you were going to wholesale anyway all help. Programs are graded on equipment currency during accreditation review, and instructors are chronically short.
Instructor time is the ask most shops never think of. Accreditation requires automotive instructors to complete 20 hours of industry update training every year, so if your shop can host a session on a system your team knows, you have solved a problem the instructor has to solve anyway. The lightest lift of all is guest instruction: one hour, one topic, in front of students who have never met a shop owner.
None of this is charity. It is recruiting with a longer lead time.
Step 3: Decide what you are actually building
There are two training structures, and shops confuse them constantly.
Work-based learning is a school-run arrangement. The student is enrolled, the school coordinates placement, and your obligation ends with the semester.
A registered apprenticeship is yours. You employ the apprentice, you set the wage progression, and the training plan. It’s a heftier commitment, and the person comes out of it trained the way your shop works.
Most shops should start with the first and graduate to the second once they have run students through the bays and learned what supervision actually costs them.
Step 4: Register the apprenticeship, and know the clock
A Registered Apprenticeship is a federal designation administered by the U.S. Department of Labor, either through its Office of Apprenticeship or through a State Apprenticeship Agency. Registration is free.
Every registered program has to include five things: a paid job, a progressive wage schedule that raises pay as skills are demonstrated, structured on-the-job learning with an assigned mentor, related technical instruction, and a nationally recognized credential at completion.
The paperwork is less than owners expect. You produce a standards of apprenticeship document, an appendix laying out the work processes, the instruction outline, and the wage scale, and then an individual agreement for each apprentice.
The timeline improved this year. In a bulletin dated March 9, 2026, the Labor Department's Office of Apprenticeship committed to issuing a registration determination within 30 days of receiving a sponsor's final signed standards. That window covers the determination only. Developing the standards with an apprenticeship training representative comes first and has no fixed timeline. States that operate their own apprenticeship agencies were encouraged, not required, to adopt the 30-day standard.
Step 5: Determine mentor pay before you hire anyone
Under a flat rate, a senior technician who spends 40 minutes walking an apprentice through a diagnostic procedure has just donated 40 minutes of income. By asking that technician to mentor, you’re actually giving them a pay cut. They will say yes once, resent it, and stop.
Technicians report exactly this. WrenchWay, an industry recruiting platform, ran its 2025 Voice of the Technician survey with the National Institute for Automotive Service Excellence and drew more than 4,700 responses. Of those, 72 percent said their shop does not do a good job of teaching new technicians and compensating the people who mentor them.
Three structures address it.
Put the apprentice on hourly, not flat rate. Tiered structures like this are documented in the trade press. One approach reported by Fleet Maintenance pays A-level technicians roughly $55 per flat-rate hour and B-level roughly $35, while C-level apprentices earn $20 to $25 an hour and assist the A-techs while they learn. Explaining the tiers to the whole shop upfront keeps anyone from guessing why the new person is paid differently.
Pay the mentor for instruction time separately. Some union agreements in the trades pay a flat-rate journeyman double time for time actually spent instructing an apprentice. A shop can do the same thing at a simpler rate: an hourly premium logged against training time, paid on top of flat-rate production.
Guarantee the mentor's week. A weekly hour guarantee removes the downside entirely. The mentor stops doing math every time the apprentice asks a question.
The market is already moving this direction. WrenchWay's 2026 report found that 43 percent of automotive technicians prefer a hybrid structure of hourly or salary pay plus a production bonus. Whatever you choose, decide it before the apprentice starts. A mentor who finds out in week three that mentoring is unpaid is a mentor you have lost.
Step 6: Deal with the tool problem or lose the hire
A new graduate with no tools cannot work, and acquiring tools is the wall most of them hit.
WrenchWay reports that 33% of technicians say the biggest challenge of being a new technician is the tool investment. Its 2026 survey found only 11% of technicians say their employer provides an adequate tool allowance or reimbursement.
The barrier shows up on the school side, too. Among the 13,370 people who applied for TechForce Foundation scholarships between December 2024 and December 2025, 46 percent named hidden costs, including tools, supplies, and housing, as their primary obstacle.
Some shops offer technicians interest-free tool loans repaid through payroll deduction, alongside a structured apprenticeship with master-technician mentors and employer-paid certification. That gives the technician a reason to stay.
What money is available
Training an apprentice is subsidized more heavily than most shop owners realize.
On-the-job training funds through your local Workforce Development Board. Under the federal Workforce Innovation and Opportunity Act, employers are commonly reimbursed 50% of an eligible trainee's wage during a defined training period, and more in some local jurisdictions. Reimbursement runs through a contract with your local board, not an application to Washington, D.C., so rates, caps, and eligibility are set locally. New Jersey, for example, caps each reimbursement at $10,000 per participant over six months. Registered Apprenticeships are automatically eligible training providers.
State apprenticeship credits and grants. These are active, they vary widely, and the amounts are not trivial.
For instance, South Carolina expanded its credit effective May 21, 2024. An employer can claim the greater of the cost of the apprenticeship, with up to $6,000 available for a young apprentice. Retain the apprentice after completion and the $1,000 credit continues for up to three more years. The statewide program is capped at $5 million a year and awarded on a first-come, first-served basis, so filing early matters.
Montana runs two separate credits. The Apprenticeship Tax Credit provides $750 for each new registered apprentice, or $1,500 if the apprentice is a veteran, and requires that you register as a Montana Registered Apprenticeship sponsor. The Trades Education and Training Credit is a different instrument covering employer-paid trades education, worth up to $2,000 per employee with a $25,000 annual cap per employer.
Pennsylvania funds a grant rather than a credit. The Foundations in Industry Training program provides $3,000 per apprentice per year for related technical instruction for up to three years with a maximum of five apprentices per employer annually. The state's 2026-27 budget, signed July 12, 2026, allocated $3 million to the program. Because it is a competitive grant with application windows, it rewards shops that are watching for the opening.
Check your own state before assuming there is nothing. The U.S. Labor Department maintains a state-by-state list of apprenticeship tax credits and tuition support.
Scholarships on the student side. The TechForce Foundation awards roughly $6.5 million a year in scholarships and works with more than 1,400 schools.
What a trained apprentice returns
A 2024 review published by the U.S. Labor Department's Chief Evaluation Office concluded that the most rigorous available estimates put employer returns from Registered Apprenticeship between 40 and 90 percent, meaning shops receive $1.40 to $1.90 back for every dollar invested.
A more granular 2022 study prepared for the Labor Department by the research firm Abt Associates surveyed 68 employers covering 2,854 apprentices. It found a productivity return of 44.3 percent, and a median direct productivity benefit of $7,980 per apprentice over the five years after program completion.
Frequently asked questions
How does a repair shop start an apprenticeship program? Start by joining the advisory committee at a local accredited automotive program, then take a student through work-based learning before committing to a formal structure. When you are ready to register, contact the U.S. Department of Labor Office of Apprenticeship or your state apprenticeship agency. Registration is free.
How long does it take to register an apprenticeship program? The U.S. Labor Department's Office of Apprenticeship committed in March 2026 to issuing registration determinations within 30 days of receiving final signed standards. That window covers the determination only. Developing the standards with an apprenticeship training representative comes first and has no fixed timeline. States that operate their own apprenticeship agencies were encouraged, not required, to adopt the 30-day standard.
How do you pay a mentor technician who is on flat rate? Three approaches work: keep the apprentice on hourly so the mentor's flat-rate production is not diluted, pay the mentor an hourly premium for logged instruction time on top of production, or guarantee the mentor a set number of hours per week. Decide before the apprentice starts.
Are there tax credits for hiring an apprentice? Several states run apprenticeship credits and grants tied to registered programs. South Carolina offers the greater of the apprenticeship cost up to $4,000 or $1,000 per apprentice, with additional years available for retained apprentices. Montana offers $750 per new registered apprentice, or $1,500 for a veteran. Pennsylvania funds a grant of $3,000 per apprentice per year for classroom instruction. The U.S. Department of Labor maintains a state-by-state list at apprenticeship.gov.
How many automotive technicians graduate each year? Postsecondary automotive programs produced 41,726 completions in the 2023-24 academic year, according to the TechForce Foundation, a 10.9 percent increase year over year. That only covers 59 percent of annual demand. The Bureau of Labor Statistics projects roughly 70,000 openings per year for automotive service technicians and mechanics through 2034.
What do trade school automotive programs need from shops? Work-based learning placements, current equipment, advisory committee participation, guest instruction, and help meeting the 20 hours of annual industry update training that accredited programs require of their instructors.
Technician Life & Careers
The Trade School Pipeline: Tap Local Programs for Your Next Hire
Automotive program completions grew 10.9% last year. Here is how a repair shop builds a hiring pipeline with a local school.
Kris Turner
Automotive program completions are at their highest level in more than a decade. The shops that recruit those graduates win.
Ask any instructor at your local automotive repair program where this year's students are going after graduation and they will know. Those decisions were made months ago, often in favor of the shops who take part in automotive repair education programs.
Owners who sit on advisory committees, donate tools, or who spend an hour in front of a class have an advantage because they are tapping the next generation of talent.
This matters more than it did previously because the pool of graduates is increasing. Completions at U.S. postsecondary automotive programs reached 41,726 in the 2023-2024 academic year, a 10.9% increase over the prior year and the third straight year of growth, according to the TechForce Foundation, a nonprofit that tracks technician supply and demand using federal education data.
That is the most automotive graduates the industry has produced since 2012. If you have been posting jobs and waiting for people to apply, you’re already behind the curve. You are competing against owners who made themselves known to the next generation of technicians.
The technician shortage gap remains
Growth does not mean the technician shortage is over.
The U.S. Bureau of Labor Statistics, the federal agency that produces the country's employment data, projects about 70,000 openings a year for automotive service technicians through 2034. TechForce, a nonprofit organization that supports technicians through their careers, calculates that current automotive training output covers 59% of annual demand. Over five years, the foundation puts the automotive shortfall at a whopping 354,323 technicians.
Even though the pool grew, it is still not enough to fix the technician shortage. Every new technician has choices, and the real question is whether your shop is one of them.
Here are a few practical tips for improving your technician pipeline.
Step 1: Join a local auto repair program's advisory committee
Joining an advisory committee costs nothing and is the single highest-return move available to you.
Automotive programs accredited by the ASE Education Foundation, the accrediting arm of the National Institute for Automotive Service Excellence, are required to run a local advisory committee. The standards call for a minimum of five members meeting at least twice a year. That committee reviews the program's facility, equipment, and task list, and it rates the program against the accreditation standards.
This is an opportunity for local shops to introduce themselves to the next generation and build a solid talent pipeline.
The ASE Education Foundation works with more than 2,300 automotive training programs nationally. To find yours, call the automotive instructor at your nearest high school career center or community college and ask when the advisory committee meets and ask to attend the next one.
Step 2: Give schools something they can use
Instructors are not looking for a check. They are looking for the things a school budget will not cover.
Start with a work-based learning slot, meaning a student is placed in your bays for a semester, supervised, doing real repair orders. Equipment helps, too. Scan tools, a running engine, or a late-model vehicle you were going to wholesale anyway all help. Programs are graded on equipment currency during accreditation review, and instructors are chronically short.
Instructor time is the ask most shops never think of. Accreditation requires automotive instructors to complete 20 hours of industry update training every year, so if your shop can host a session on a system your team knows, you have solved a problem the instructor has to solve anyway. The lightest lift of all is guest instruction: one hour, one topic, in front of students who have never met a shop owner.
None of this is charity. It is recruiting with a longer lead time.
Step 3: Decide what you are actually building
There are two training structures, and shops confuse them constantly.
Work-based learning is a school-run arrangement. The student is enrolled, the school coordinates placement, and your obligation ends with the semester.
A registered apprenticeship is yours. You employ the apprentice, you set the wage progression, and the training plan. It’s a heftier commitment, and the person comes out of it trained the way your shop works.
Most shops should start with the first and graduate to the second once they have run students through the bays and learned what supervision actually costs them.
Step 4: Register the apprenticeship, and know the clock
A Registered Apprenticeship is a federal designation administered by the U.S. Department of Labor, either through its Office of Apprenticeship or through a State Apprenticeship Agency. Registration is free.
Every registered program has to include five things: a paid job, a progressive wage schedule that raises pay as skills are demonstrated, structured on-the-job learning with an assigned mentor, related technical instruction, and a nationally recognized credential at completion.
The paperwork is less than owners expect. You produce a standards of apprenticeship document, an appendix laying out the work processes, the instruction outline, and the wage scale, and then an individual agreement for each apprentice.
The timeline improved this year. In a bulletin dated March 9, 2026, the Labor Department's Office of Apprenticeship committed to issuing a registration determination within 30 days of receiving a sponsor's final signed standards. That window covers the determination only. Developing the standards with an apprenticeship training representative comes first and has no fixed timeline. States that operate their own apprenticeship agencies were encouraged, not required, to adopt the 30-day standard.
Step 5: Determine mentor pay before you hire anyone
Under a flat rate, a senior technician who spends 40 minutes walking an apprentice through a diagnostic procedure has just donated 40 minutes of income. By asking that technician to mentor, you’re actually giving them a pay cut. They will say yes once, resent it, and stop.
Technicians report exactly this. WrenchWay, an industry recruiting platform, ran its 2025 Voice of the Technician survey with the National Institute for Automotive Service Excellence and drew more than 4,700 responses. Of those, 72 percent said their shop does not do a good job of teaching new technicians and compensating the people who mentor them.
Three structures address it.
Put the apprentice on hourly, not flat rate. Tiered structures like this are documented in the trade press. One approach reported by Fleet Maintenance pays A-level technicians roughly $55 per flat-rate hour and B-level roughly $35, while C-level apprentices earn $20 to $25 an hour and assist the A-techs while they learn. Explaining the tiers to the whole shop upfront keeps anyone from guessing why the new person is paid differently.
Pay the mentor for instruction time separately. Some union agreements in the trades pay a flat-rate journeyman double time for time actually spent instructing an apprentice. A shop can do the same thing at a simpler rate: an hourly premium logged against training time, paid on top of flat-rate production.
Guarantee the mentor's week. A weekly hour guarantee removes the downside entirely. The mentor stops doing math every time the apprentice asks a question.
The market is already moving this direction. WrenchWay's 2026 report found that 43 percent of automotive technicians prefer a hybrid structure of hourly or salary pay plus a production bonus. Whatever you choose, decide it before the apprentice starts. A mentor who finds out in week three that mentoring is unpaid is a mentor you have lost.
Step 6: Deal with the tool problem or lose the hire
A new graduate with no tools cannot work, and acquiring tools is the wall most of them hit.
WrenchWay reports that 33% of technicians say the biggest challenge of being a new technician is the tool investment. Its 2026 survey found only 11% of technicians say their employer provides an adequate tool allowance or reimbursement.
The barrier shows up on the school side, too. Among the 13,370 people who applied for TechForce Foundation scholarships between December 2024 and December 2025, 46 percent named hidden costs, including tools, supplies, and housing, as their primary obstacle.
Some shops offer technicians interest-free tool loans repaid through payroll deduction, alongside a structured apprenticeship with master-technician mentors and employer-paid certification. That gives the technician a reason to stay.
What money is available
Training an apprentice is subsidized more heavily than most shop owners realize.
On-the-job training funds through your local Workforce Development Board. Under the federal Workforce Innovation and Opportunity Act, employers are commonly reimbursed 50% of an eligible trainee's wage during a defined training period, and more in some local jurisdictions. Reimbursement runs through a contract with your local board, not an application to Washington, D.C., so rates, caps, and eligibility are set locally. New Jersey, for example, caps each reimbursement at $10,000 per participant over six months. Registered Apprenticeships are automatically eligible training providers.
State apprenticeship credits and grants. These are active, they vary widely, and the amounts are not trivial.
For instance, South Carolina expanded its credit effective May 21, 2024. An employer can claim the greater of the cost of the apprenticeship, with up to $6,000 available for a young apprentice. Retain the apprentice after completion and the $1,000 credit continues for up to three more years. The statewide program is capped at $5 million a year and awarded on a first-come, first-served basis, so filing early matters.
Montana runs two separate credits. The Apprenticeship Tax Credit provides $750 for each new registered apprentice, or $1,500 if the apprentice is a veteran, and requires that you register as a Montana Registered Apprenticeship sponsor. The Trades Education and Training Credit is a different instrument covering employer-paid trades education, worth up to $2,000 per employee with a $25,000 annual cap per employer.
Pennsylvania funds a grant rather than a credit. The Foundations in Industry Training program provides $3,000 per apprentice per year for related technical instruction for up to three years with a maximum of five apprentices per employer annually. The state's 2026-27 budget, signed July 12, 2026, allocated $3 million to the program. Because it is a competitive grant with application windows, it rewards shops that are watching for the opening.
Check your own state before assuming there is nothing. The U.S. Labor Department maintains a state-by-state list of apprenticeship tax credits and tuition support.
Scholarships on the student side. The TechForce Foundation awards roughly $6.5 million a year in scholarships and works with more than 1,400 schools.
What a trained apprentice returns
A 2024 review published by the U.S. Labor Department's Chief Evaluation Office concluded that the most rigorous available estimates put employer returns from Registered Apprenticeship between 40 and 90 percent, meaning shops receive $1.40 to $1.90 back for every dollar invested.
A more granular 2022 study prepared for the Labor Department by the research firm Abt Associates surveyed 68 employers covering 2,854 apprentices. It found a productivity return of 44.3 percent, and a median direct productivity benefit of $7,980 per apprentice over the five years after program completion.
Frequently asked questions
How does a repair shop start an apprenticeship program?
Start by joining the advisory committee at a local accredited automotive program, then take a student through work-based learning before committing to a formal structure. When you are ready to register, contact the U.S. Department of Labor Office of Apprenticeship or your state apprenticeship agency. Registration is free.
How long does it take to register an apprenticeship program?
The U.S. Labor Department's Office of Apprenticeship committed in March 2026 to issuing registration determinations within 30 days of receiving final signed standards. That window covers the determination only. Developing the standards with an apprenticeship training representative comes first and has no fixed timeline. States that operate their own apprenticeship agencies were encouraged, not required, to adopt the 30-day standard.
How do you pay a mentor technician who is on flat rate?
Three approaches work: keep the apprentice on hourly so the mentor's flat-rate production is not diluted, pay the mentor an hourly premium for logged instruction time on top of production, or guarantee the mentor a set number of hours per week. Decide before the apprentice starts.
Are there tax credits for hiring an apprentice?
Several states run apprenticeship credits and grants tied to registered programs. South Carolina offers the greater of the apprenticeship cost up to $4,000 or $1,000 per apprentice, with additional years available for retained apprentices. Montana offers $750 per new registered apprentice, or $1,500 for a veteran. Pennsylvania funds a grant of $3,000 per apprentice per year for classroom instruction. The U.S. Department of Labor maintains a state-by-state list at apprenticeship.gov.
How many automotive technicians graduate each year?
Postsecondary automotive programs produced 41,726 completions in the 2023-24 academic year, according to the TechForce Foundation, a 10.9 percent increase year over year. That only covers 59 percent of annual demand. The Bureau of Labor Statistics projects roughly 70,000 openings per year for automotive service technicians and mechanics through 2034.
What do trade school automotive programs need from shops?
Work-based learning placements, current equipment, advisory committee participation, guest instruction, and help meeting the 20 hours of annual industry update training that accredited programs require of their instructors.
Technician Life & Careers
A Day in the Modern Bay: What the Role of Technicians Looks Like Today
Sensor calibrations went from less than 1% of repair estimates to more than 23% in eight years. Here is what the modern automotive technician job actually involves.
Kris Turner
Ask most people what an automotive technician does, and they will describe a job that stopped existing around 2005. They’ll talk about oil changes, brakes, and belts, but that’s only a part of the work performed today.
Here’s what a real morning in the shop actually looks like: A late-model crossover comes in for a lane-departure warning that will not clear. The technician checks the manufacturer's service procedure and finds that the forward-facing camera needs a static calibration, which requires a level floor, controlled lighting, and a manufacturer-specified target placed at an exact distance and angle from the vehicle centerline. From there, the technician connects the scan tool, completes the required drive cycle, and verifies that the system reads the road correctly.
The whole job takes most of a morning, and none of it involves a wrench.
Today's automotive technician diagnoses electronic faults, calibrates the cameras and radar sensors behind driver-assist systems, and works on high-voltage electric and hybrid systems, alongside traditional mechanical repair. Sensor calibrations appeared less than 1% of repair estimates in 2017 but were more than 23% by 2025, according to CCC Intelligent Solutions.
How much of the job is computers now?
The repair work performed today showcases exactly how much computerized vehicles have changed the game.
Recalls used to name a part, bracket, bolt, or fuel line. The fix was to take the bad part out and put a good one in. Today, the repairs look much different.
For instance, look at what the U.S. National Highway Traffic Safety Administration announced March 23, 2026. Ford recalled 254,640 vehicles because a computer module could reset without warning. When it did, drivers lost rearview camera images along with pre-collision assist, lane-keeping assist, and blind-spot monitoring. Nothing wore out and nothing was leaking. A module reset and caused three safety systems to go dark. The remedy was a software update. Another critical example: In October 2025, Chrysler recalled 24,238 Jeep Wrangler plug-in hybrids because of a software error in an over-the-air update that could cause a loss of drive power. The update was the defect.
That is what makes auto repair work harder than it used to be. Some failures have no visible cause. They also are often intermittent, so the issue might not reproduce in the bay. This is not a fringe category of work. The U.S. National Highway Traffic Safety Administration logged 891 vehicle recalls in 2025 covering 29.2 million vehicles, according to the agency's annual safety recall report published in March 2026. That same report shows manufacturers remedied more than 21 million recalled vehicles through over-the-air updates between 2021 and 2025.
Ordinary repair work runs on the same skills. CCC Intelligent Solutions, which processes estimating and claims data for the auto repair industry, reports that almost 70% of repairable appraisals now include a diagnostic scan. Technicians tracing issues that leave no physical evidence are doing work that did not exist 20 years ago.
What does the diagnostic side of the job actually require?
Three things a technician has to hold at once.
A scan tool and the manufacturer's information. Reprogramming a module takes a pass-through tool, which works across brands under a standard called J2534, and a paid subscription to that manufacturer's service software. Federal emissions rules require automakers to support pass-through reprogramming on engine, transmission, and other emissions-related modules. Everything else is up to the manufacturer, which is why the same tool that reflashes a powertrain module on one brand cannot touch a camera module on another. The tool will not tell you which procedure to run, and guessing produces a returned vehicle.
A security credential. On many vehicles, the diagnostic port is behind a secure gateway. To perform security-sensitive work such as key programming, immobilizer resets, or all-keys-lost situations, a technician needs credentials from the Vehicle Security Professional registry run by the National Automotive Service Task Force, the industry body that coordinates service information access. Without a valid credential, the scan tool will simply refuse the function.
Judgment. A trouble code tells you which circuit reported a problem. It does not tell you why. That distance between the code and the cause is where the repair work actually lives, and it is not something a tool does for you.
What is ADAS calibration, and why does it matter so much now?
Advanced driver assistance systems are the cameras, radar units, and sensors behind automatic emergency braking, lane assist, blind spot monitoring, and adaptive cruise control. When a vehicle with those systems gets repaired, the sensors often have to be recalibrated so they aim where the manufacturer says they should.
The volume growth here is the single clearest number in the whole trade.
CCC Intelligent Solutions reported that calibrations appeared in less than 1% of repairable appraisals in 2017. By 2025, that figure was more than 23%, showcasing clear growth. On insurer direct-repair estimates specifically, CCC recorded calibrations at 35.6% in the third quarter of 2025, up from 26.9% a year earlier, with diagnostic scans on almost all of those estimates.
In eight years, a procedure that showed up on one job in a hundred now shows up on one job in four.
Calibration comes in two forms, and plenty of vehicles require both. Static calibration happens with the vehicle stationary, using manufacturer-specified targets at precise distances under controlled lighting on a level floor. Dynamic calibration requires driving the vehicle at manufacturer-specified speeds under specific road conditions, usually clear lane markings and dry pavement.
None of that is guesswork, and none of it is optional. A camera that is 1 degree off aims several feet off at the far end of its range.
The demand side is not slowing. The Highway Loss Data Institute, the research arm affiliated with the Insurance Institute for Highway Safety, projects that front automatic emergency braking will go from 32.4% of registered vehicles in 2024 to 55% by 2029.
Is the federal automatic emergency braking rule still coming?
Yes, with a caveat worth stating precisely.
In May 2024, the National Highway Traffic Safety Administration issued a final rule, Federal Motor Vehicle Safety Standard No. 127, requiring automatic emergency braking, pedestrian automatic emergency braking, and forward collision warning on all light vehicles under 10,000 pounds. The performance bar is high. The vehicle has to stop without colliding into another vehicle at speeds up to 62 mph, apply the brakes automatically up to 90 mph when a collision is imminent, and detect and avoid pedestrians in daylight and in darkness at speeds up to 45 mph. The compliance date is Sept. 1, 2029, for most light vehicles.
The agency projects the standard will save at least 360 lives and prevent at least 24,000 injuries each year.
The caveat: the rule has been contested. The Alliance for Automotive Innovation, the trade association representing most major automakers, petitioned for reconsideration and later filed for review in federal court, arguing the no-contact requirement at 62 mph is not technically practicable. The Transportation Department's regulatory agenda, published in the Federal Register on Aug. 14, 2026, states that the agency is considering a proposal to extend the compliance date by two years and to allow repeated test trials.
For a technician, the regulatory outcome barely changes the work. The hardware is already going on cars voluntarily, as the Highway Loss Data Institute projections show. Every one of those sensors is something that has to be verified after a repair.
What is it like to work on an electric vehicle?
Different, and less common than headlines suggest, which is exactly why it is worth learning now. The Alliance for Automotive Innovation put electric vehicles at 2.25% of all vehicles on the road in mid-2025.
The number that matters for shop work is the age. S&P Global Mobility reported in May 2025 that the average light vehicle in the United States is a record 12.8 years old, across roughly 289 million vehicles. The average battery-electric vehicle is 3.7 years old. Most of those cars are still under warranty, and the wave of out-of-warranty electric vehicles has not hit yet, but it is coming.
The work itself shifts rather than shrinks. Oil changes, exhaust, and spark plugs go away. Tires wear faster under more weight and instant torque. Regenerative braking extends pad life but changes how the brake system behaves. Thermal management, 12-volt systems, and high-voltage battery diagnostics all become harder.
The best methodology-disclosed data on the difference comes from We Predict, a vehicle data analytics firm. It found that diagnosing an electric vehicle took about twice as long as diagnosing a gas-powered vehicle, that repairs took one-and-a-half times as long, and that the average labor rate on that work ran about one-and-a-half times higher.
What does high-voltage work require?
Real safety discipline and credentials.
The National Institute for Automotive Service Excellence offers two high-voltage electrical safety certifications. Level 1 covers electrical safety awareness for anyone who might encounter an electrified vehicle, including service advisors and lot staff. Level 2 covers technicians working directly on high-voltage systems. Both are valid for five years.
The underlying safety framework is not automotive-specific. It comes from NFPA 70E, the National Fire Protection Association standard for electrical safety in the workplace, and from federal workplace safety regulation. Under OSHA standard 1910.137, Class 0 insulating rubber gloves rated to 1,000 volts must be electrically tested before first issue and every six months after. De-energizing procedures, approach boundaries, and personal protective equipment are all specified.
This is the part of the job that reads least like the stereotype. It is closer to industrial electrical work than to anything people picture when they hear the word garage.
Shop readiness has not caught up. PartsTech, a parts-sourcing platform, surveyed 752 repair shops for its 2025 state of the industry report and found fewer than a third reported that their technicians had received electric-vehicle-specific training. Roughly a quarter of shops do not work on them at all.
What does the work pay?
The U.S. Bureau of Labor Statistics reported a median annual wage of $49,670 for automotive service technicians and mechanics in May 2024, or $23.88 an hour, across employment of 805,600. The lowest 10% earned under $33,660. The top 10% earned more than $80,850.
That spread is the real story. The distance between the bottom and the top is about $47,000 a year in the same occupation, and the work described in this article is most of what separates them. Diagnostic ability, calibration capability, and high-voltage qualification are where the top of that range lives.
The Bureau projects about 70,000 openings a year through 2034, most from workers leaving the occupation rather than from growth. Typical entry requires a postsecondary nondegree award, not a four-year degree.
Why can't shops fill these bays?
Because the pipeline is not close to keeping up, and the public image of auto repair is out of date.
The TechForce Foundation, a nonprofit that tracks technician supply and demand, counts 70,865 annual openings against a projected annual supply of 50,085 technicians, a shortfall of 20,780 people every year.
Money is part of it. In the 2025 Voice of the Technician survey conducted by WrenchWay, a technician recruiting platform, with the National Institute for Automotive Service Excellence, 78% of responding technicians named higher pay as the most urgent fix for the shortage.
Equipment and training are the other parts. In that same survey, 87% of technicians called proper equipment a must-have, but only 58% said their shop provided it. Sixty-seven percent called paid training a must-have, and only 51% said they got it.
Read those two gaps together and the recruiting problem starts to look like an equipment problem. A shop that cannot calibrate cannot offer the work that makes this career worth entering.
And one finding points straight at the pipeline: 55% of those technicians knew in high school that they wanted this career. The decision gets made early, which means the description of the job has to reach people early, and it has to be accurate.
Frequently asked questions
Do automotive technicians still do mechanical work?
Yes. Brakes, suspension, steering, and engine work remain a large share of the job. What changed is that electronic diagnosis, module programming, and sensor calibration now sit alongside that work rather than replacing it. CCC Intelligent Solutions found that almost 70% of repairable appraisals now include a diagnostic scan.
What is ADAS calibration?
It is the process of re-aiming and reinitializing the cameras, radar units, and sensors that run driver-assist features so they read the road correctly after a repair. Static calibration uses manufacturer-specified targets on a level floor under controlled lighting. Dynamic calibration requires a road drive at specified speeds. Many vehicles require both.
How much training does a technician need to work on electric vehicles?
The National Institute for Automotive Service Excellence offers a Level 1 electrical safety awareness certification for anyone who may encounter an electrified vehicle and a Level 2 certification for technicians working directly on high-voltage systems. Both last five years.
Is the automatic emergency braking mandate still in effect?
Yes. The National Highway Traffic Safety Administration issued Federal Motor Vehicle Safety Standard No. 127 in May 2024 with a Sept. 1, 2029, compliance date. The Transportation Department's August 2026 regulatory agenda indicates the agency is considering proposing a two-year extension, but no such proposal has been published, and the 2029 date currently stands.
What does an automotive technician earn?
The Bureau of Labor Statistics reported a median annual wage of $49,670 in May 2024, with the top 10% earning more than $80,850.
Do automotive repair professionals need a four-year degree?
No. The Bureau of Labor Statistics lists a postsecondary nondegree award as the typical entry-level education for the occupation.
Is there actually demand for new technicians?
The TechForce Foundation's 2026 study counts 70,865 annual openings against a projected supply of 50,085, a gap of 20,780 technicians a year. The U.S. Bureau of Labor Statistics projects about 70,000 openings a year in the occupation through 2034.